ThingsBoard PE Cloud Getting Started
Once you signed-up to ThingsBoard PE Cloud we automatically create separate Tenant account for you. The email and password you have specified allows you to login as Tenant Administrator. Also, we automatically provision sample Smart Metering application for your Tenant. The purpose of this application is to show how different ThingsBoard features are used to implement smart metering use cases. Let’s briefly review those use cases one-by-one:
- Provisioning of devices and assets - we have modeled two Buildings, four Apartments and 12 smart devices in those apartments. We have created realistic data emulators that are launched and periodically generate data used by the dashboards and analytics.
- Grouping the devices and assets - we have grouped devices and assets based on their type for convenience.
- Data visualization - we have created complex multi-page navigation Dashboard that visualizes Buildings, Apartments, and data from Devices.
- Scheduling - we have scheduled configuration updates to the devices.
- Reporting - we have scheduled reports to be generated.
- Data Export - platform allows to export data from the dashboards.
- White labeling - platform web interface allows you to customize your logo, color scheme, login page and apply custom translations.
- Customer Dashboards - we have automatically created multiple customer accounts and assign certain devices to those accounts. You can login and review the dashboards from the customer point of view.
- Aggregation and alarms - application automatically collect statistics about total power/water consumption and generate alarms if certain thresholds are violated.
- Integrations and converters - entry point to quickly connect physical devices using NB IoT, SigFox, LoRaWAN or other connectivity solutions and platforms.
- Custom widgets - platform contains few examples of custom data visualization widgets.
- Custom mail settings - learn how to configure your own email server to start receiving email alerts and reports.
- Enable Real-Time Data Generation - enable data generation for Smart Metering Demo.
Smart Metering Model Definition
There are different Buildings in the city. Each Building has a few Apartments and each Apartment has 3 devices - Energy/Water meters and Thermostat. Buildings, and Apartments are represented as Assets. Relations with type ‘Contains’ are used to represent how assets/devices are connected between each other.
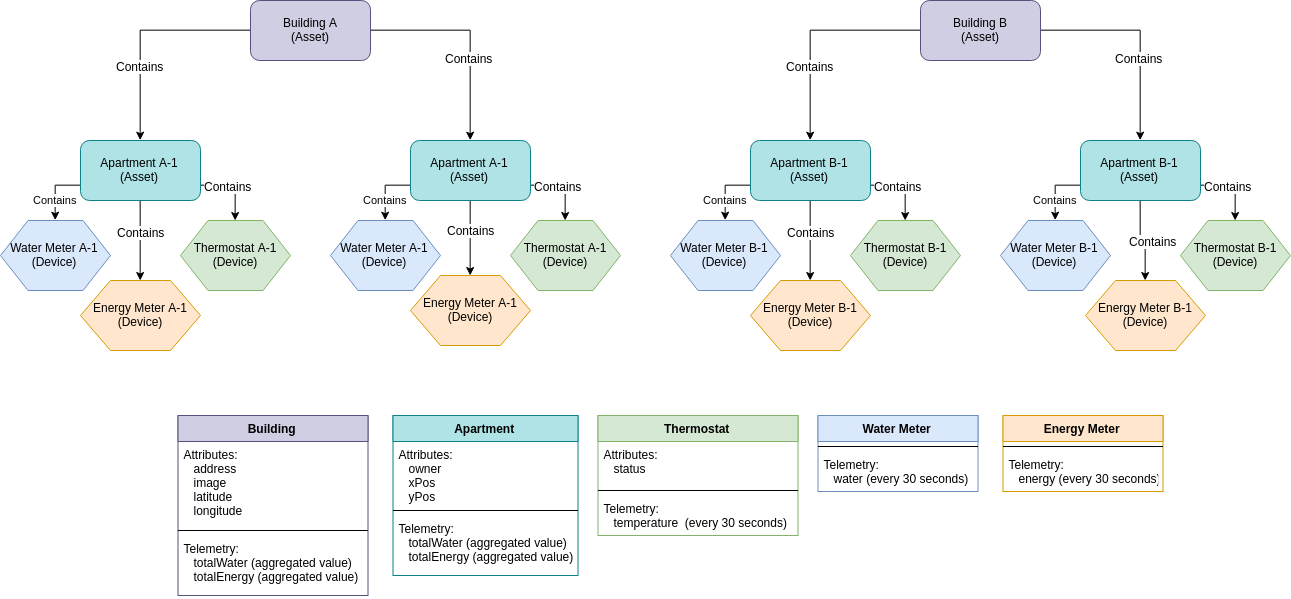
Devices submit telemetry every 30 seconds.
We want to know how much water/energy was consumed on Building level. Buildings and Apartments have aggregation telemetry that represents an aggregated value from all related devices.
If Energy consumption during the last 20 minutes is more than 40 kWh then we want to generate a Critical Alarm for that Building. Otherwise, if consumption is lower then 10 kWh - we want to clear current Building Alarm if it exists.
Device & Asset Groups
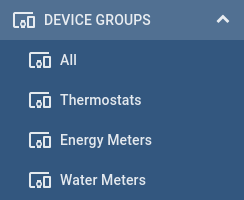
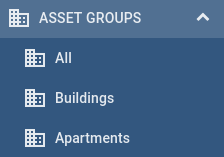 There are 3 Device Groups created for each Device Type - Thermostats, Energy Meters, Water Meters. Each group contains devices of specific type.
There are also 2 Asset Groups created for each Asset Type - Apartments, Buildings. Each group contains assets of specific type.
 Each group view can be configured and additional columns can be added, like ‘Assigned Customer’, attribute or latest telemetry value.
Also, you can add different action buttons, for example, open dashboard for the selected device.
Asset and Device Groups can be used for resolving dashboard aliases.
More information can be found in Device & Asset groups documentation.
In device details page, in the ‘Attributes’ tab, you can find server attributes that are responsible for handling device lifecycle events. ThingsBoard monitors device state (online/offline) and generates device offline events if a device is offline is more then 60 seconds. You can generate alarms and send notifications when your critical devices are going offline.
More information about Device Connectivity Status events can be found in Device Connectivity Status documentation.
Dashboards
Demo Smart Metering
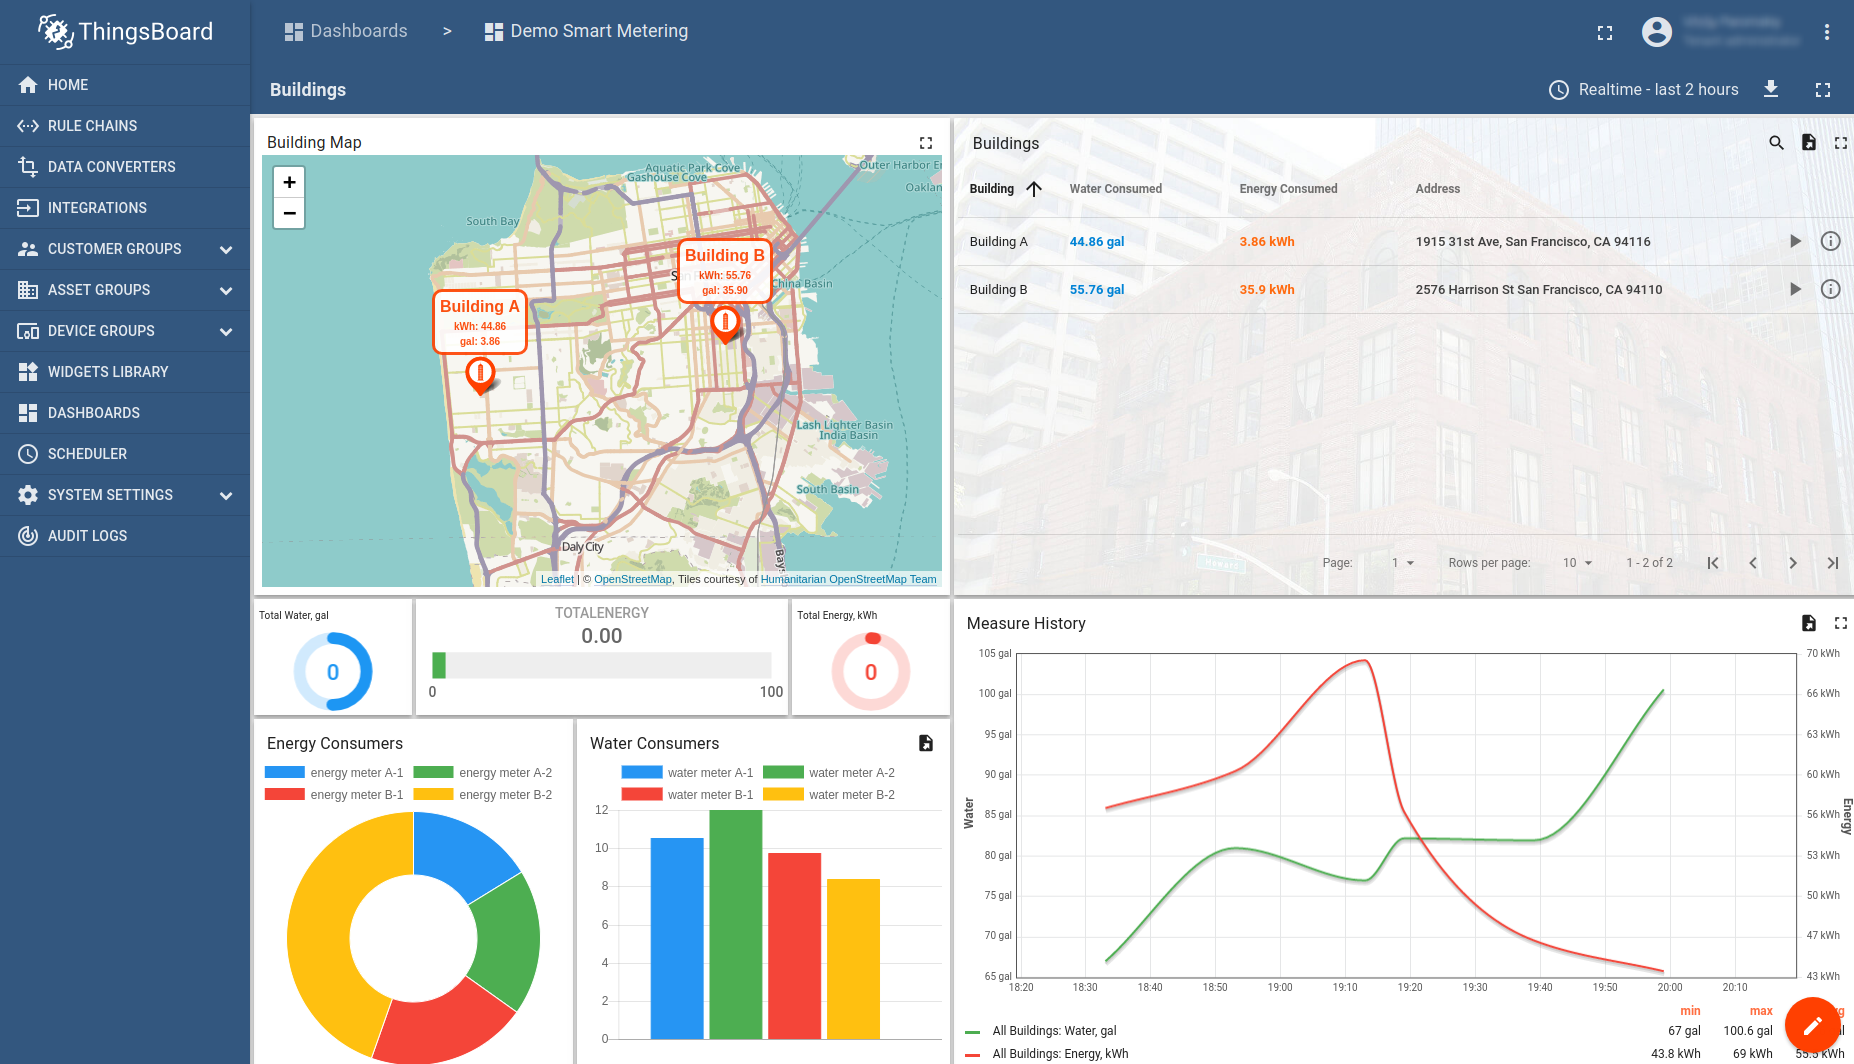
It is a complex multi-page navigation Dashboard that visualizes Buildings, Apartments, and data from Devices. You can use it to learn how to:
- Navigate between different dashboard states and update current dashboard state via configured widget actions (Map/Table widgets)
- Execute custom actions (show popup in Building Table widget)
- Group time-series data on chart/table with a configured time interval (Building Hourly Usage/Measurement History widgets)
- Show assets/devices on earth/image map (Building/Apartment Map widgets)
- Send commands to devices (Apartment dashboard state / RPC)
- Apply custom widget styles
- Show/Clear Alarms
More information about dashboard configuration you can find in Dashboard development guide.
Demo Reporting
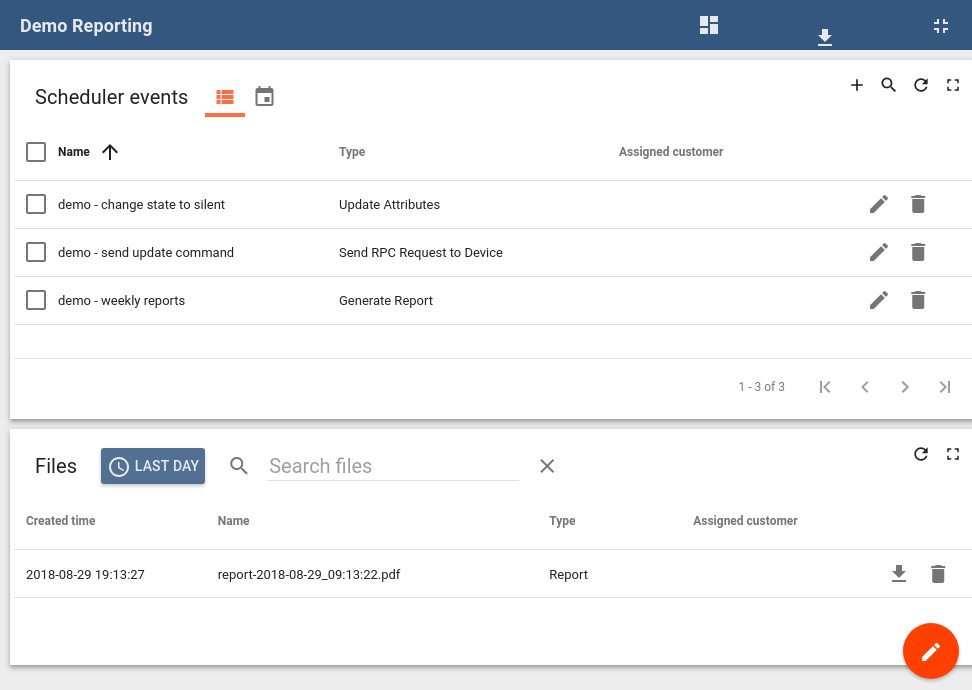 This Dashboard contains widgets for creating Scheduled Events and browse report files. After you will sign in, you will have 1 report already generated and available for download from the 'Files' widget. Also, you will have 3 predefined Scheduled Events.
 - generate report
- send RPC command
- update attribute
More info about Scheduled Events you can find in Scheduling section of this guide.
Exporting
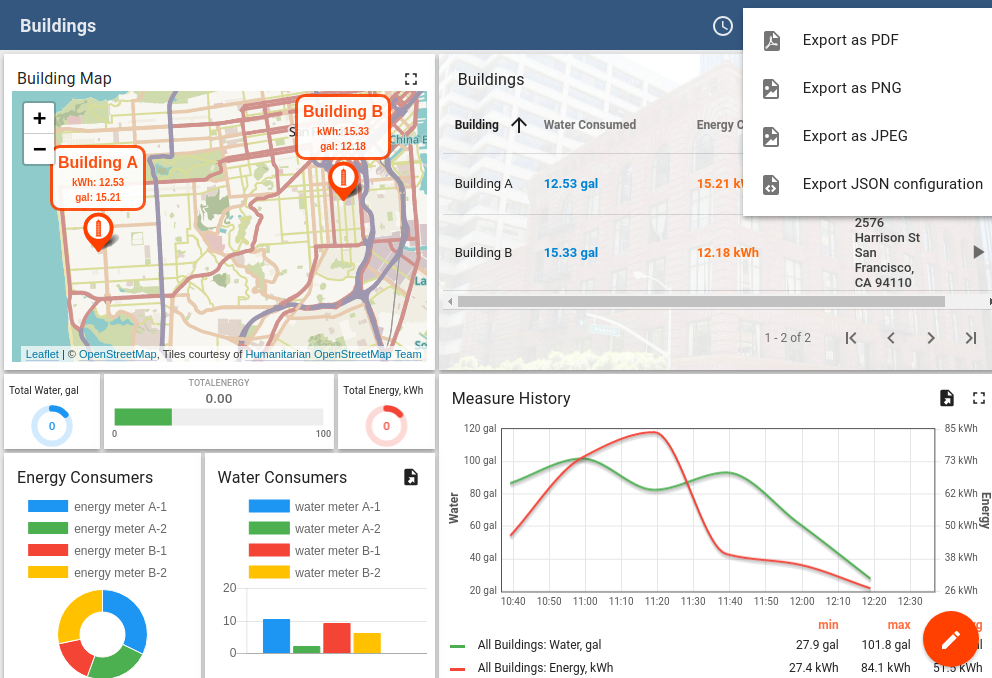
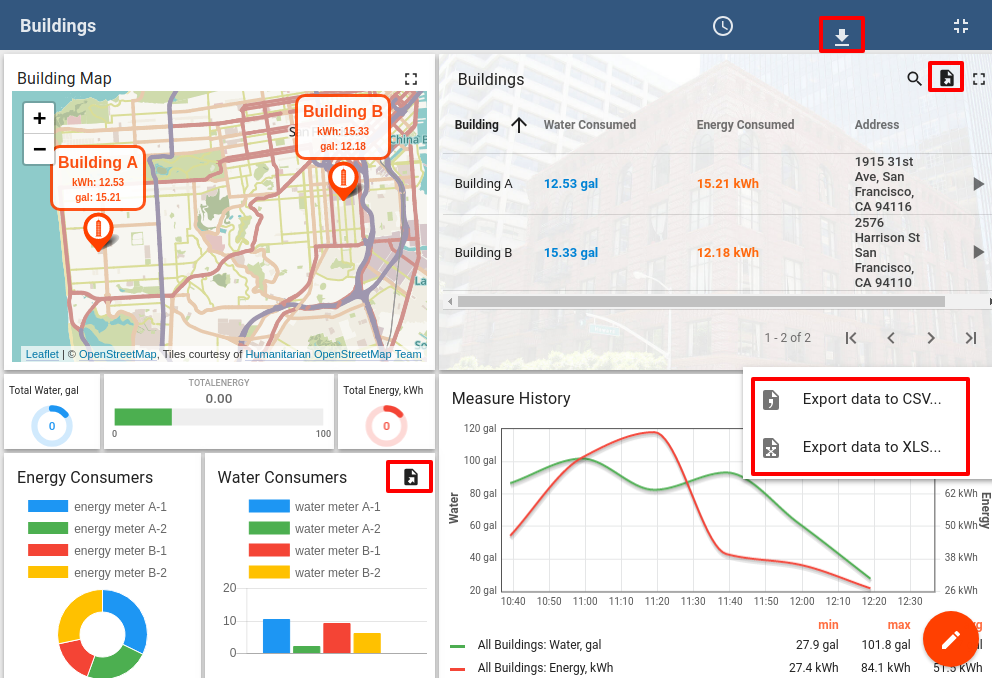
You can export any Dashboard into different formats - PDF, PNG, JPEG. Also, you can export data from any widget into SCV format.
Custom Widgets
In some cases, you need to create custom widgets for your solution. In Widgets Library we have created custom widget bundle - ‘Demo Custom Widgets’ and added 3 custom widgets in this bundle.
- Send RPC - you can send RPC command to the selected device
- Update Attribute - update/create an attribute of the selected device
- Aeration Status - widget is subscribed to the device ‘status’ attribute and changes its behavior when an attribute value is changed.
- Navigate Button - executes a configurable action when the button is pressed
There is a ‘Demo Custom Widgets’ dashboard that is configured to use custom widgets form that bundle:
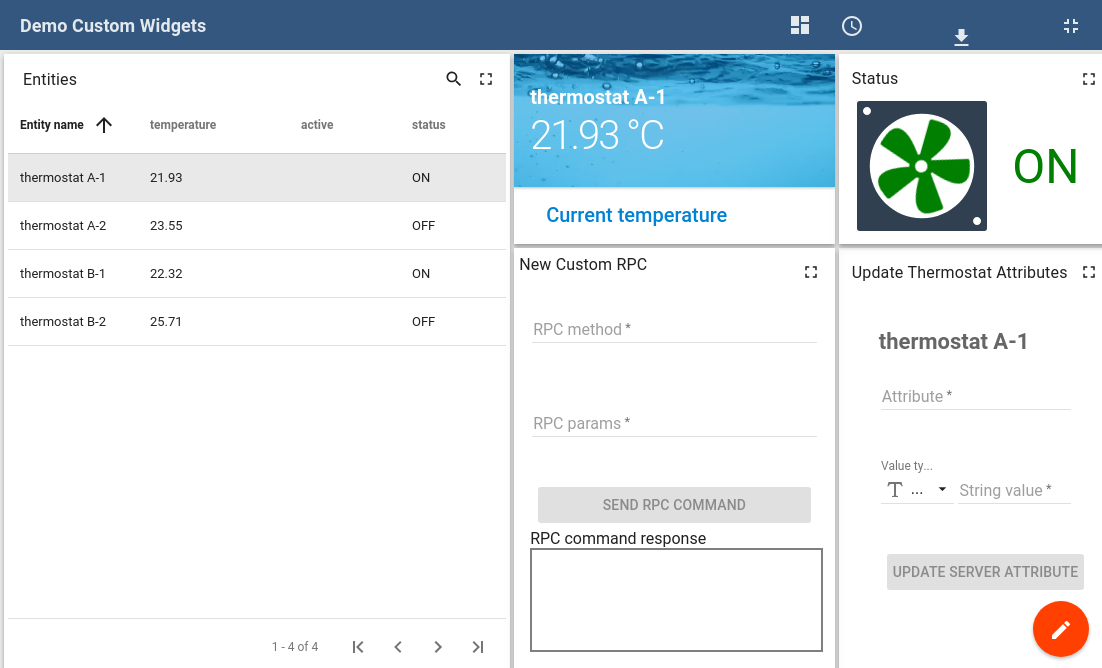
More information about custom widget creation you can find in Widgets Development Guide.
Customers
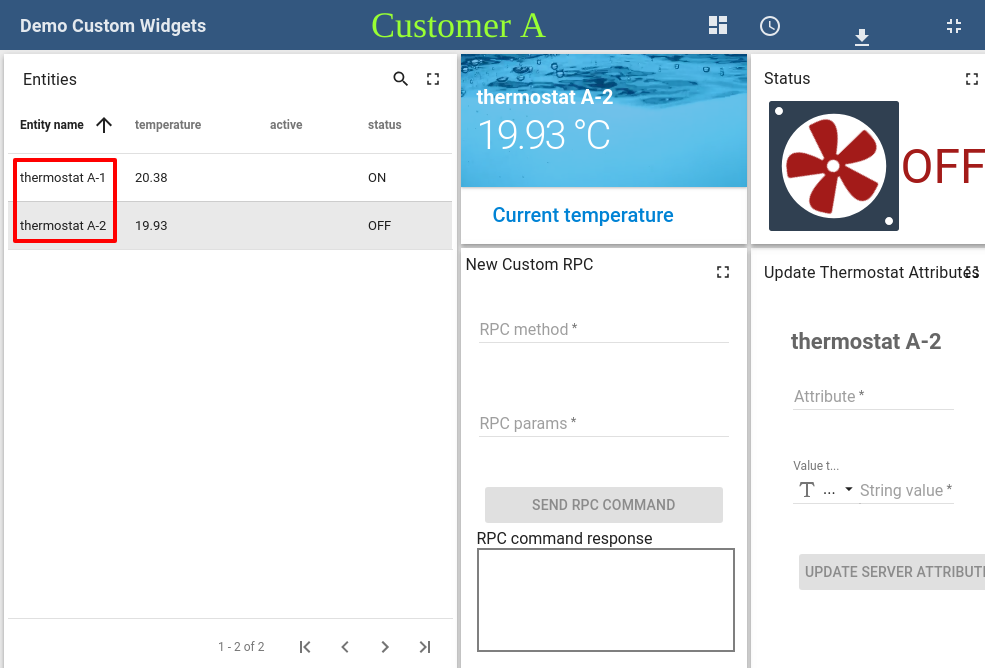
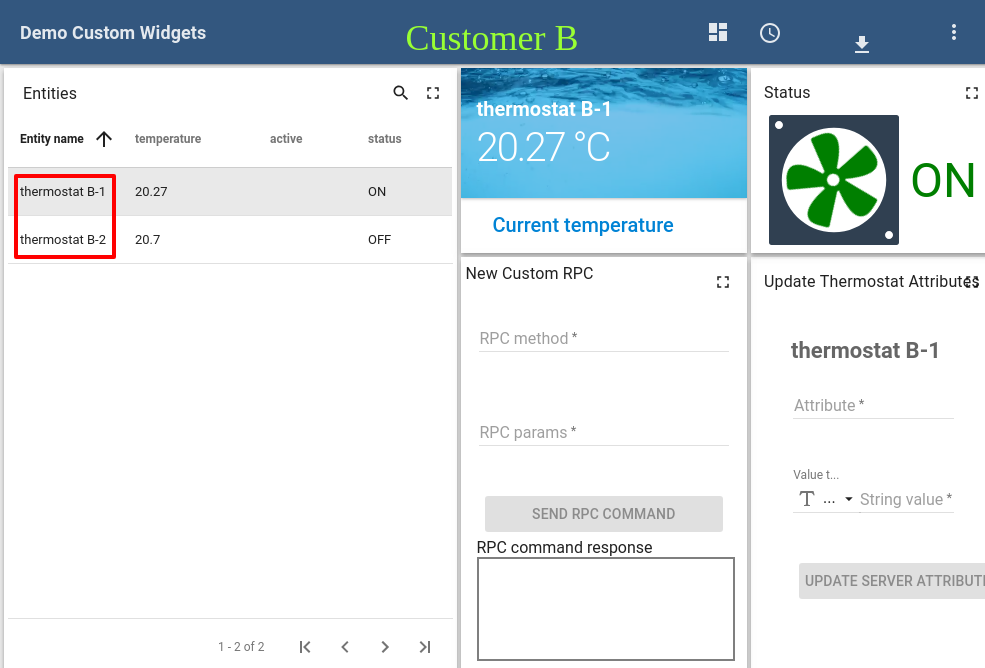
There are 2 Customers that are created in the scope of the Smart Metering Demo - ‘Customer A’ and ‘Customer B’.
| Customer Name | User Login | User Password | Assigned Assets/Devices | Assigned Dashboards |
| Customer A | ca_[yourmail@testmail.org] | customer | Building A Apartment A-1 Apartment A-2 All Apartment A-1 devices All Apartment A-2 Devices |
Demo Custom Widgets |
| Customer B | cb_[yourmail@testmail.org] | customer | Building B Apartment B-1 Apartment B-2 All Apartment B-1 devices All Apartment B-2 Devices |
Demo Custom Widgets Demo Reporting |
*Please replace [yourmail@testmail.org] with your real email that was used for registration.
Customers have access only to the assigned dashboard/assets/devices. If few customers have access to the same Dashboard, they will be able to see data only from assigned Assets/Devices. To verify this you can log in as Customer and find that on ‘Demo Custom Widgets’ Dashboard you can see Thermostats only from the single Building.
Scheduling
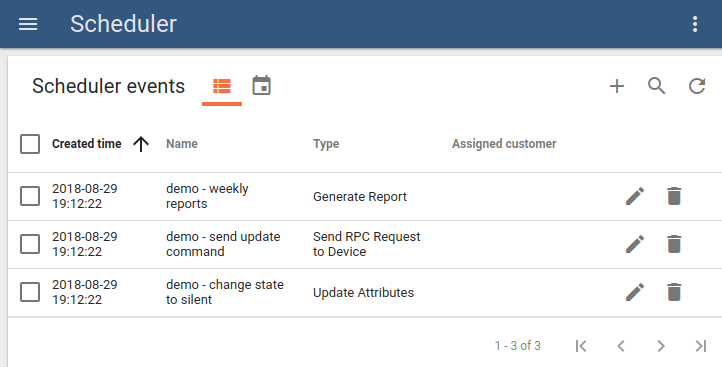
Scheduled events are used to execute predefined Tasks on a scheduled basis. For example, you want to Enable cooler system every morning and disable it every evening. There are 3 redefined Scheduled Events:
Generate Report
Every Monday, at the specified time, a PDF report will be created. ‘Demo Smart Metering’ Dashboard will be used for report generation. You can configure to send a report to your email, by enabling ‘Send Email’ checkbox in Event configuration. All reports will be saved in Database and available for download via ‘Files’ widget on the ‘Demo Reporting’ Dashboard.
More information about Reporting feature you can find in Reporting Guide.
Send RPC command
This Event will send RPC command to all devices from the ‘Thermostat’ Group every Monday and Tuesday. Each Device will receive this RPC command:
{
  "method": "updateToVersion",
  "params": {"1.246"}
}
More information about RPC feature you can find in RPC Guide.
Update attribute
This Event will update ‘State’ attribute for all Apartments with the ‘silent’ value. This action repeated every day.
More information about ThingsBoard Scheduler you can find in Scheduler Guide.
White Labeling
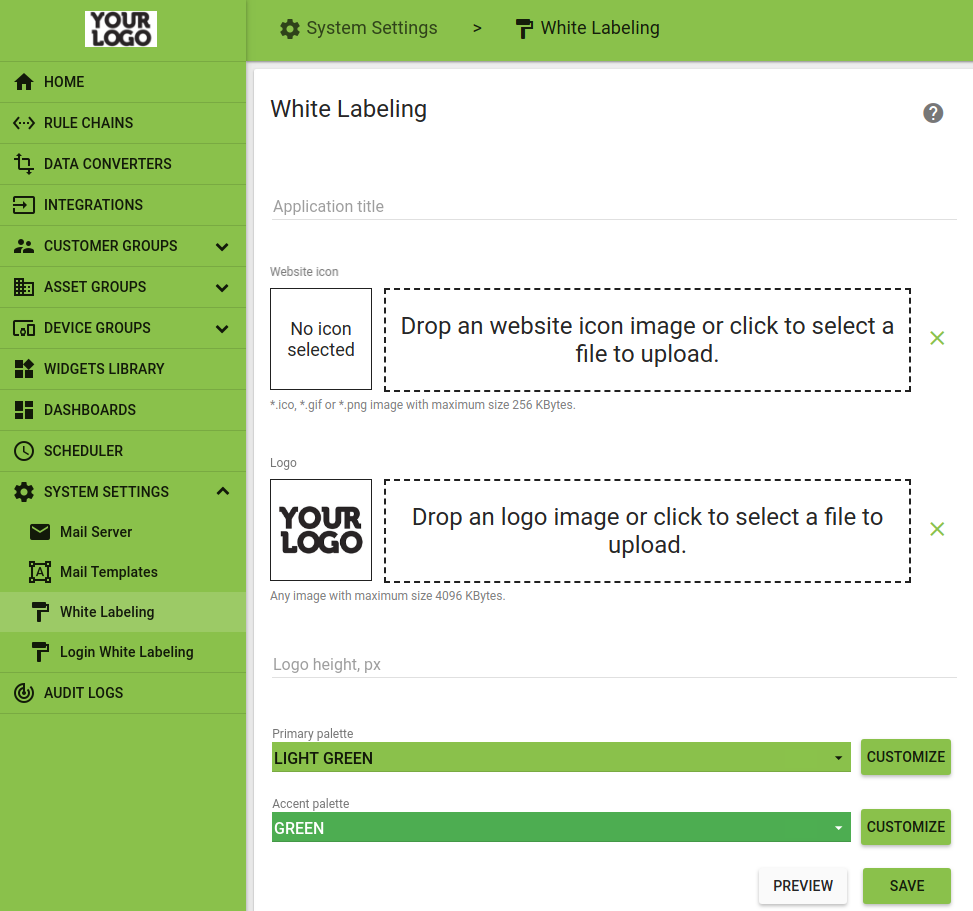
ThingsBoard web interface allows you to configure your company or product logo and color scheme. The following configuration options are available:
- Configure color scheme, icon, and favicon
- Tenant Administrator is able to set up custom email server settings and customer email templates to interact with the users.
More information you can find in White Labeling Guide.
Rule Chains
There are 5 preconfigured Rule Chains in the system:
- Root Rule Chain (default Rule Chain) - used as main entry point for all events in the System, handle incoming telemetry/attributes, scheduled events
and routing messages to other Rule Chains. You can see that after incoming telemetry from devices is saved in the Database, messages are routed
to the ‘Smart Metering Aggregation’ Rule Chain.

- Generate Report (default Rule Chain) - handle reporting scheduled events and Send Emails with reports if required.
- Smart Metering Aggregation (for Smart Metering Demo) - this Chain is described in the next chapter.
- Smart Metering Alerts (for Smart Metering Demo) - this Chain is described in the next chapter.
- Smart Metering Device Emulator (for Smart Metering Demo) - all registered demo devices are emulated using this Rule Chain. For each Device ‘Generator Node’ is created that generates device’s telemetry and forward it to the ‘Root Rule Chain’.
Aggregation
In our Demo scenario, devices submit their telemetry (water & energy consumption) every 30 seconds. And we want to know how much water/energy was consumed on Building level. So we want to sum all the measurements from all devices in the building within 20 minutes intervals. ‘Smart Metering Aggregation’ Rule Chain perform this aggregation using this algorithm:
- Filter incoming telemetry form Water Meter or Energy Meter
- Duplicated telemetry to related Apartment/Building/All Building Asset using ‘Change Originator’ Node and Relation Query.
- Aggregate measurements for each Asset using 20 minutes time interval
- Save aggregated value in the Database

After Aggregated telemetry saved, a message is routed to the ‘Smart Metering Alerts’ Rule Chain for generating Alerts if consumption threshold is reached.
Alerts
If Energy consumption during the last 20 minutes is more than 40 kWh then we want to generate a Critical Alert for that Building. Otherwise, if consumption is lower then 10 kWh - we want to clear current Building Alert if it exists. ‘Smart Metering Alerts’ Rule Chain implements this logic.
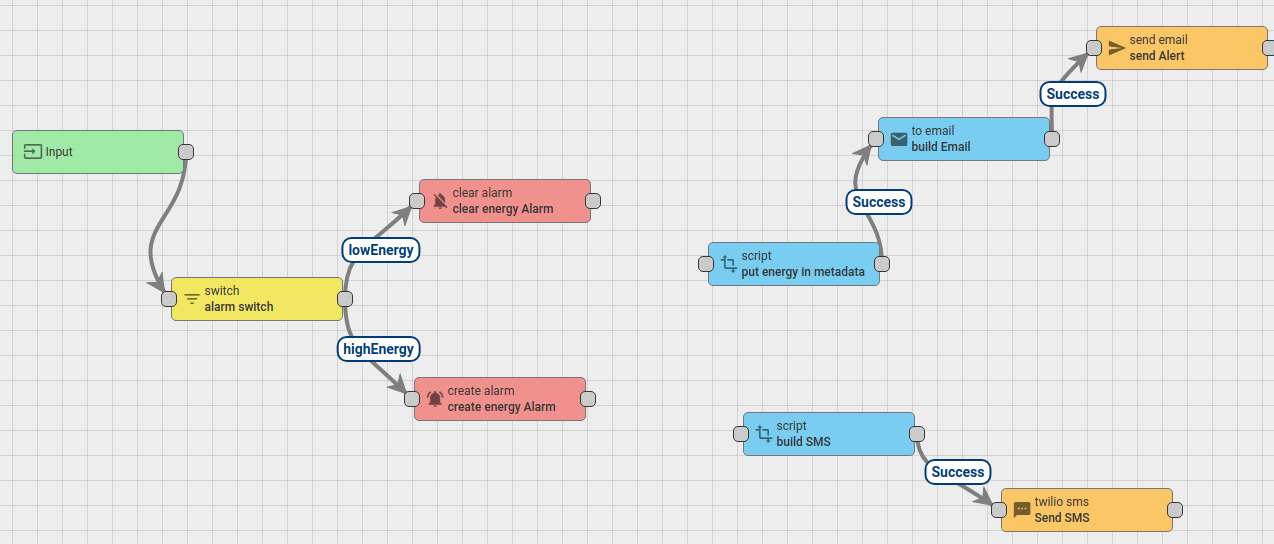
As an option, we can send an Email or SMS when an alert is generated\cleared.
For sending Email when Alert is created, you need to create relation from ‘Create Energy Alarm’ node to the ‘Put Energy in Metadata’ node using ‘Created’ link type. After that, you will need to edit ‘Build Email’ node and update ‘To email’ property to your email address.
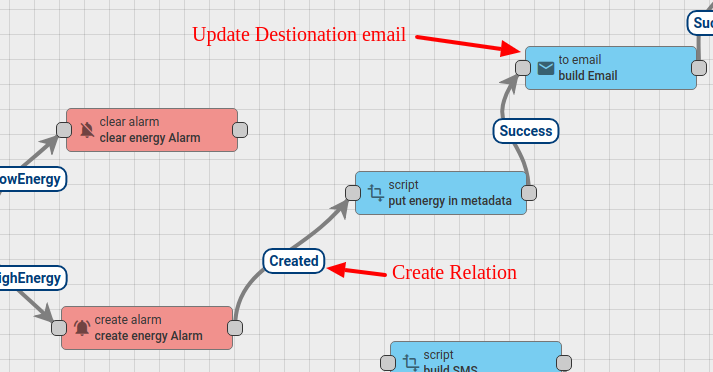
For sending SMS when Alert is created, you need to create relation from ‘Create Energy Alarm’ node to the ‘Build SMS’ node using ‘Created’ link type. After that, you will need to edit ‘Send SMS’ node and update credentials for connecting to the Twilio Service.

More information about Rule Chains you can find in Rule Engine Overview.
Integrations & Converters
ThingsBoard Platform integrations feature was designed for two primary use cases/deployment options:
- Connect existing NB IoT, LoRaWAN, SigFox and other devices with specific payload formats (JSON, Binary, Text) directly to ThingsBoard platform.
- Stream data from devices connected to existing IoT Platforms to enable real-time interactive dashboards and efficient data processing.
Uplink Converters are used for Transforming incoming message payload into the required format. Downlink Converters used for transforming outbound message payload.
You can use 2 Uplink and 2 Downlink predefined Converters as a reference for implementing your own converters.
You can find list of all supported integration types in Integration Tutorials
More information about Integrations & Converters you can find in Platform Integrations Overview.
Configure mail settings
Some ThingsBoard features are using Tenant Email Settings for sending emails - for reporting, send alert notifications, etc. By default, Tenant Email Settings are blank and if you want to receive emails from the ThingsBoard you will need to connect ThingsBoard to external Email Server. It can be a Gmail or SendGrid or any other SMTP provider. Just open ‘System Settings’ -> ‘Mail Server’ and clear ‘Use System Mail Server Settings’ checkbox.
Important - if you will not make this configuration, you will not be able to send emails from the ThingsBoard.
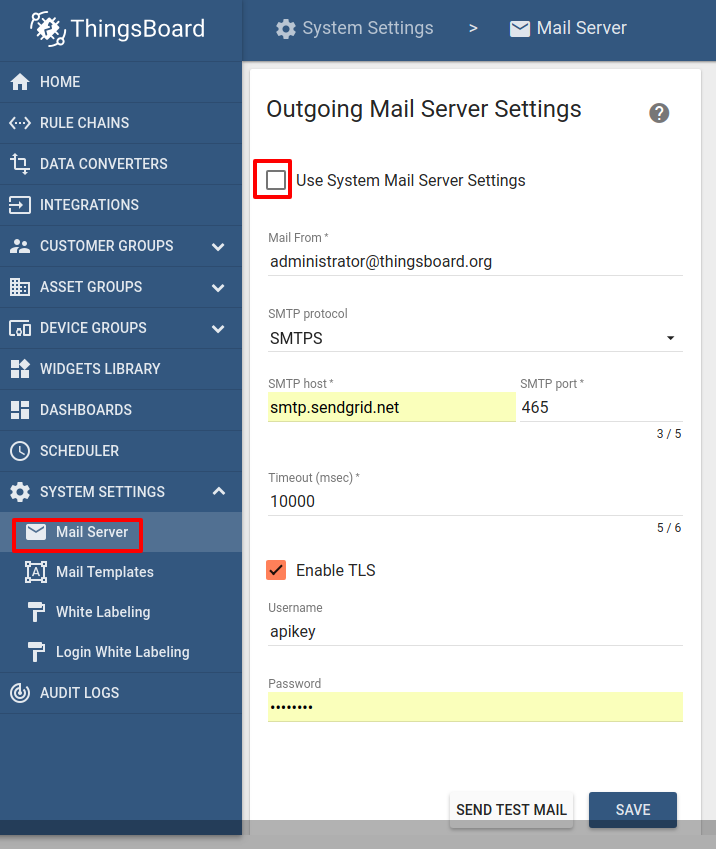
Please find instructions how configure SMTP settings:
Enable Real-Time Data Generation
There is a Rule Chain Smart Metering Device Emulators that generates data for the Smart Metering Demo. Data generation is disabled by default. If you want to see how Smart Metering Dashboard is updated with the Real-Time Data you will need to enable Data Generation.
Navigate to Rule Chains -> Smart Metering Device Emulators, add new node Rule Chain that will redirect messages to the Root Rule Chain. After that connect Post Telemetry node with the Root Rule Chain node using Post Telemetry link. Save Rule Chain.

After this configuration, the system will emulate data from devices that are part of the Smart Metering demo and you will see that values on the Dashboard are updated in Real-Time.