ThingsBoard Performance on different AWS instances
- Data flow and test tools
- How to repeat the tests
- Performance by AWS Instance Type
- t2.micro
- t2.medium
- c5.large
- m5.xlarge
One of the key features of ThingsBoard open-source IoT Platform is data collection and this is a crucial feature that must work reliably under a heavy long-running messages upload.
In this article, we are going to execute long-running data collection tests of ThingsBoard on different AWS instances. We are going to check how many messages per second each instance can handle and will provide the CPU and memory load stats.
Considering test results and your project requirements you will be able to identify what type of the instance is the most suitable for your project.
Data flow and test tools
IoT devices connect to ThingsBoard server via MQTT or HTTP Device API and send sample test data (single telemetry of long type) to the platform. ThingsBoard server processes MQTT or HTTP messages and stores them to Cassandra/PostgreSQL asynchronously.
As a test tool we have used updated version of Performance Test Project that is able to send messages over MQTT/HTTP Device API in an asynchronous way quite efficiently.
Considering microservice architecture of the ThingsBoard platform and to measure performance in an accurate way, we have created an additional Rule Chain Node that is able to calculate a number of messages that this Node has been received per 1 second (this is a configurable parameter that could be changed) and stores this value as telemetry on a tenant level.
This additional Rule Chain Node is located after the ‘Save telemetry’ Node of the Root Chain and calculates how many messages ThingsBoard instance processed during the performance testing. This data is stored on a tenant level as telemetry with predefined key prefix.
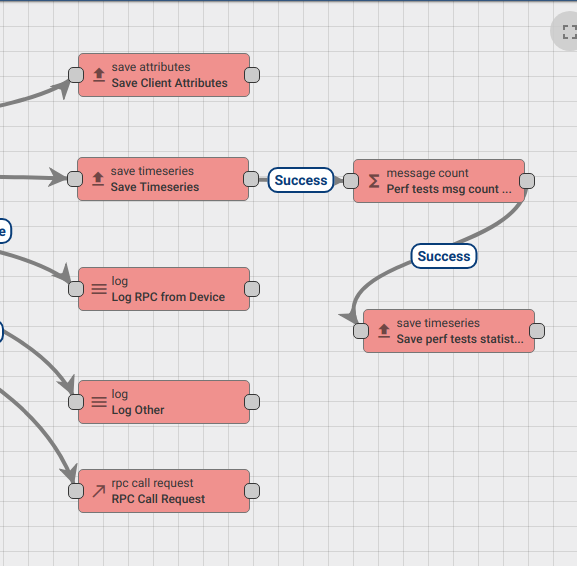
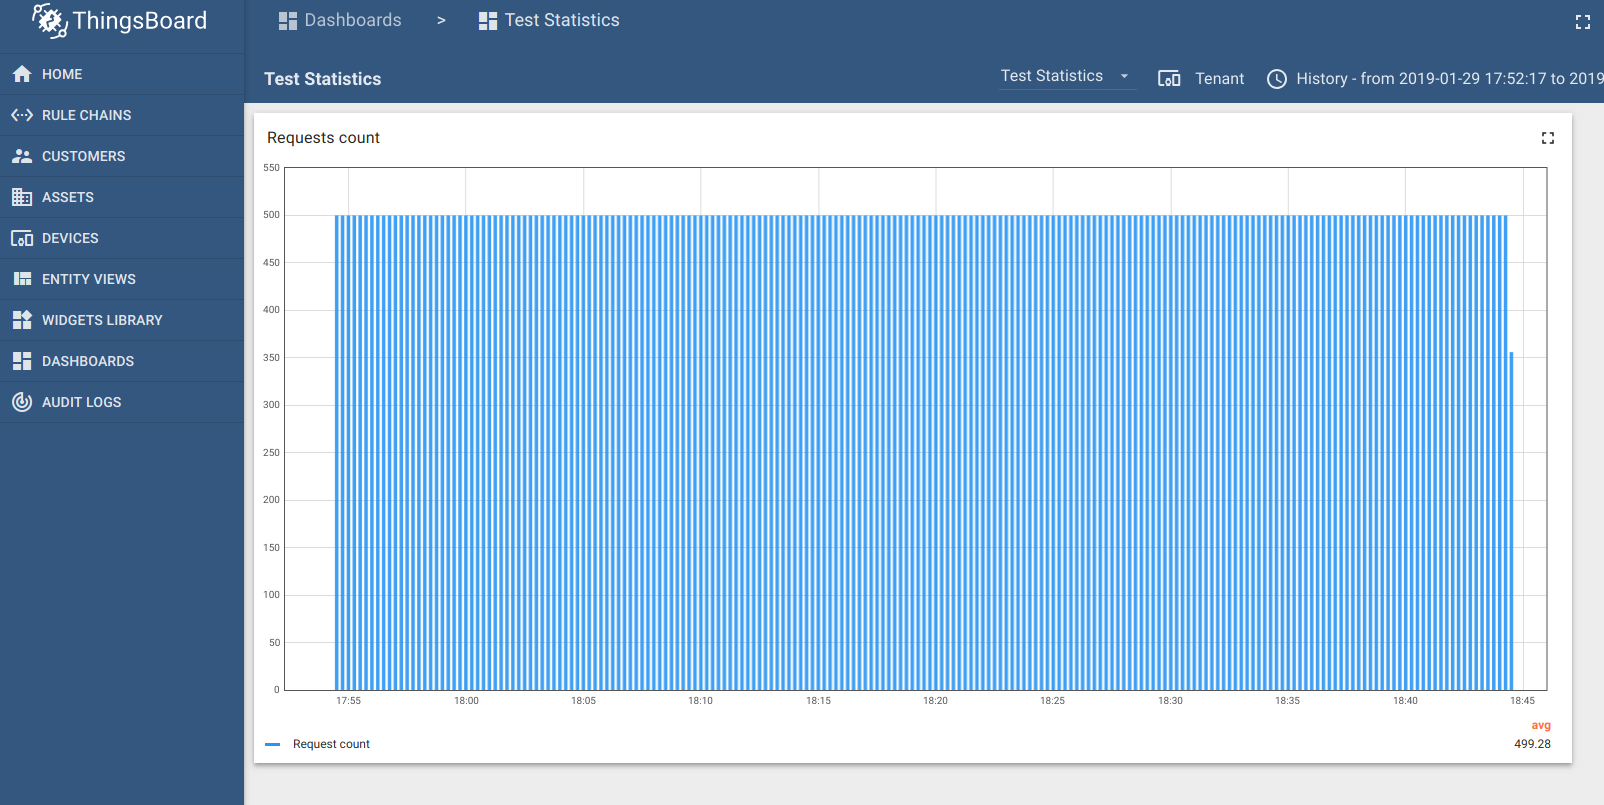
Performance Test Tool, after test completion, take this telemetry value from the platform and provides result in the console of the test:
12:20:03.772 [main] INFO  o.t.t.s.stats.StatisticsCollector - ============ Node [692dc903cf52] AVG is 500.0 per 1 second ============
12:20:03.772 [main] INFO  o.t.t.s.stats.StatisticsCollector - ============ Total AVG is 500.0 per 1 second ============
This telemetry value could be shown as well as general telemetry on the ThingsBoard Dashboard.
NOTE: If you have multiple ThingsBoard nodes in the cluster, additional Rule Chain Node will save statistics under different telemetry keys on tenant level, but Performance Test Tool in the result will aggregate these values into a single result.
How to repeat the tests
Please use documentation of the Performance Test Project for more details.
Performance by AWS Instance Type
| Instance Type | Instance details | Database Type | Device API | Number of devices | Delay between messages | Maximum number of messages |
|---|---|---|---|---|---|---|
| t2.micro | 1 vCPUs for a 2h 24m burst, 1GB | PostgreSQL | MQTT | 500 | 1000 ms | ~450/sec |
| t2.medium | 2 vCPUs for a 4h 48m burst, 4GB | PostgreSQL | MQTT | 900 | 1000 ms | ~780/sec |
| c5.large | 2 vCPUs , 4GB | PostgreSQL | MQTT | 1100 | 1000 ms | ~1020/sec |
| t2.xlarge | 4 vCPUs for a 5h 24m burst, 16GB | PostgreSQL | MQTT | 1800 | 1000 ms | ~1700/sec |
| t2.xlarge | 4 vCPUs for a 5h 24m burst, 16GB | Cassandra | MQTT | 3000 | 1000 ms | ~3000/sec |
| m5.xlarge | 4 vCPUs, 16GB, 150GB SSD mounted | Cassandra | MQTT | 3500 | 1000 ms | ~3500/sec |
| m5.xlarge | 4 vCPUs, 16GB, 150GB SSD mounted | Cassandra | HTTP | 2000 | 1000 ms | ~950/sec |
t2.micro
Performance Results
| Instance Type | Instance details | Database Type | Device API | Number of devices | Delay between messages | Maximum number of messages |
|---|---|---|---|---|---|---|
| t2.micro | 1 vCPUs for a 2h 24m burst, 1GB | PostgreSQL | MQTT | 500 | 1000 ms | ~450/sec |
Test run configuration (see Performance Test Project for more details):
...
DEVICE_API=MQTT
DEVICE_START_IDX=0
DEVICE_END_IDX=500

PUBLISH_COUNT=300
PUBLISH_PAUSE=1000
...
Test Run #1
| Instance Type | Instance details | Database Type | Device API | Number of devices | Delay between messages in millis | Count of test run hours |
|---|---|---|---|---|---|---|
| t2.micro | 1 vCPUs for a 2h 24m burst, 1GB | PostgreSQL | MQTT | 50 | 1000 ms | 10 |
Test Configuration
Test run configuration (see Performance Test Project for more details):
...
DEVICE_API=MQTT
DEVICE_START_IDX=0
DEVICE_END_IDX=50

PUBLISH_COUNT=36000
PUBLISH_PAUSE=1000
...
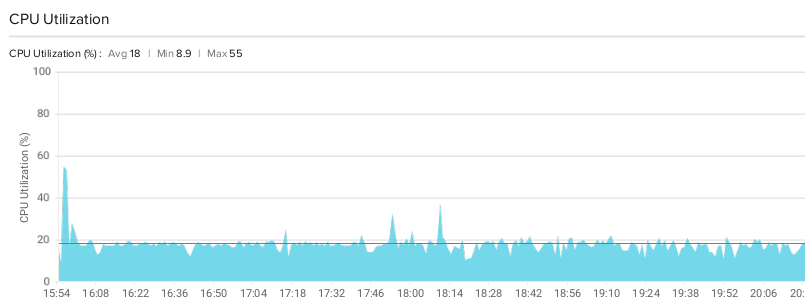
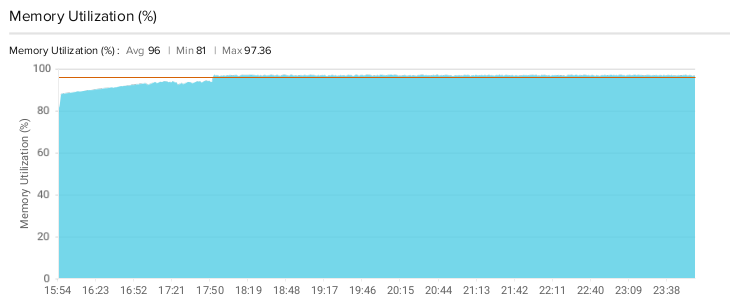
CPU/Memory Load
| Property | Avg | Min | Max |
|---|---|---|---|
| CPU Utilization (%) | 18 | 8.9 | 55 |
| Memory Utilization (%) | 96 | 81 | 97.36 |
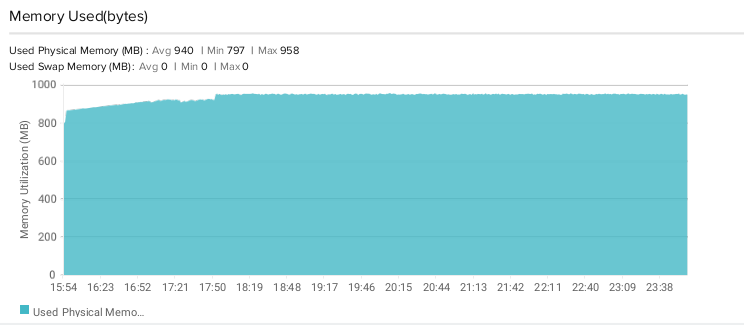
| Used Physical Memory (MB) | 940 | 797 | 958 |
CPU Utilization (%)
Memory Utilization (%)
Used Physical Memory (MB)
TB dashboard
Test Run #2
| Instance Type | Instance details | Database Type | Device API | Number of devices | Delay between messages in millis | Count of test run hours |
|---|---|---|---|---|---|---|
| t2.micro | 1 vCPUs for a 2h 24m burst, 1GB | PostgreSQL | MQTT | 100 | 1000 ms | 10 |
Test Configuration
Test run configuration (see Performance Test Project for more details):
...
DEVICE_API=MQTT
DEVICE_START_IDX=0
DEVICE_END_IDX=100

PUBLISH_COUNT=36000
PUBLISH_PAUSE=1000
...
CPU/Memory Load
| Property | Avg | Min | Max |
|---|---|---|---|
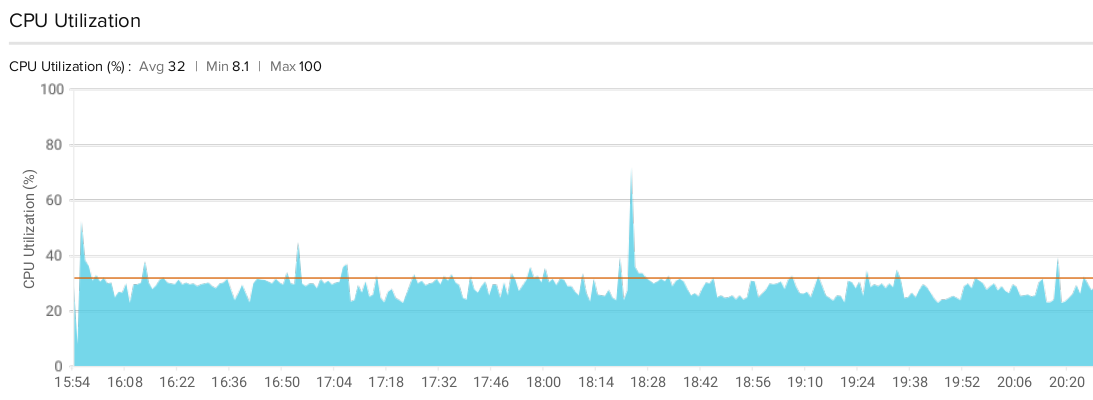
| CPU Utilization (%) | 32 | 8.1 | 100 |
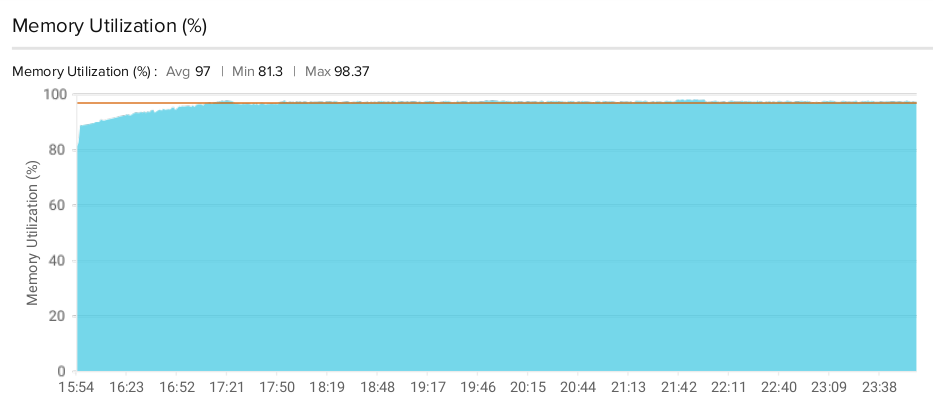
| Memory Utilization (%) | 97 | 81.3 | 98.37 |
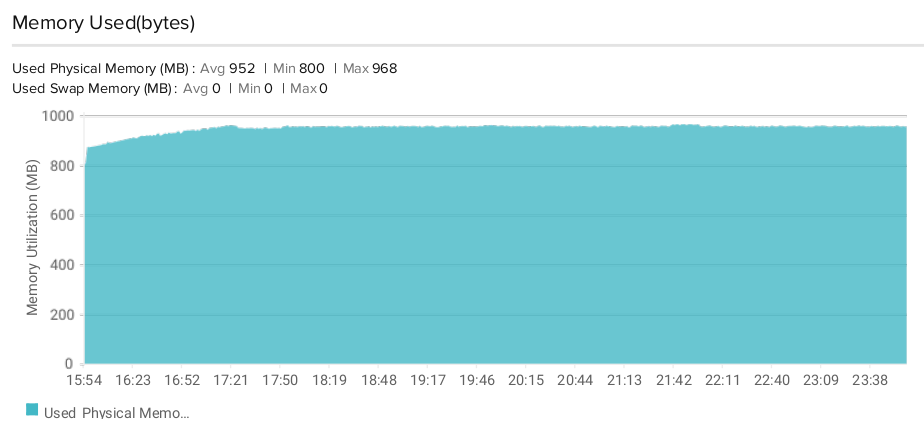
| Used Physical Memory (MB) | 952 | 800 | 968 |
CPU Utilization (%)
Memory Utilization (%)
Used Physical Memory (MB)
TB dashboard
t2.medium
Performance Results
| Instance Type | Instance details | Database Type | Device API | Number of devices | Delay between messages in millis | Maximum number of messages per second |
|---|---|---|---|---|---|---|
| t2.medium | 2 vCPUs for a 4h 48m burst, 4GB | PostgreSQL | MQTT | 900 | 1000 ms | ~780/sec |
Test run configuration (see Performance Test Project for more details):
...
DEVICE_API=MQTT
DEVICE_START_IDX=0
DEVICE_END_IDX=900

PUBLISH_COUNT=300
PUBLISH_PAUSE=1000
...
Test Run #1
| Instance Type | Instance details | Database Type | Device API | Number of devices | Delay between messages in millis | Count of test run hours |
|---|---|---|---|---|---|---|
| t2.medium | 2 vCPUs for a 4h 48m burst, 4GB | PostgreSQL | MQTT | 150 | 1000 ms | 10 |
Test Configuration
Test run configuration (see Performance Test Project for more details):
...
DEVICE_API=MQTT
DEVICE_START_IDX=0
DEVICE_END_IDX=150

PUBLISH_COUNT=36000
PUBLISH_PAUSE=1000
...
CPU/Memory Load
| Property | Avg | Min | Max |
|---|---|---|---|
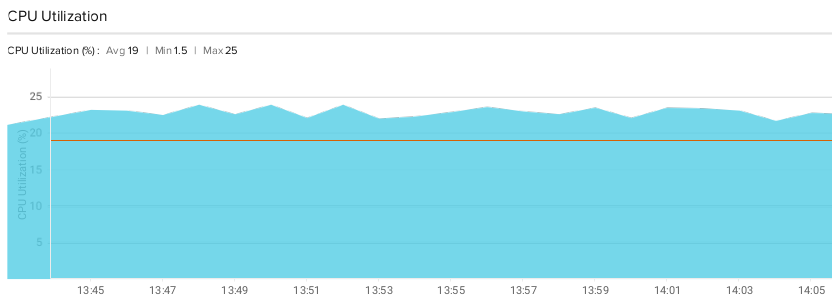
| CPU Utilization (%) | 19 | 1.5 | 25 |
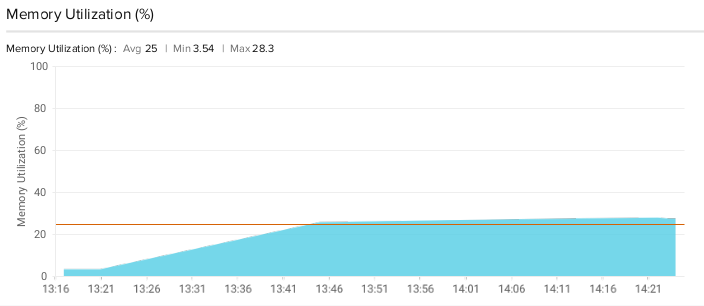
| Memory Utilization (%) | 25 | 3.54 | 28.3 |
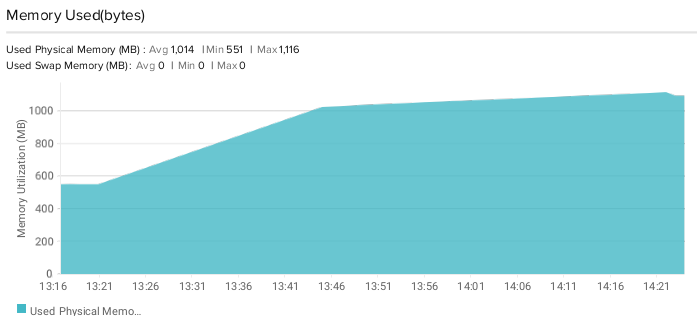
| Used Physical Memory (MB) | 1014 | 551 | 1116 |
CPU Utilization (%)
Memory Utilization (%)
Used Physical Memory (MB)
TB dashboard
Test Run #2
| Instance Type | Instance details | Database Type | Device API | Number of devices | Delay between messages in millis | Count of test run hours |
|---|---|---|---|---|---|---|
| t2.medium | 2 vCPUs for a 4h 48m burst, 4GB | PostgreSQL | MQTT | 200 | 1000 ms | 10 |
Test Configuration
Test run configuration (see Performance Test Project for more details):
...
DEVICE_API=MQTT
DEVICE_START_IDX=0
DEVICE_END_IDX=200

PUBLISH_COUNT=36000
PUBLISH_PAUSE=1000
...
CPU/Memory Load
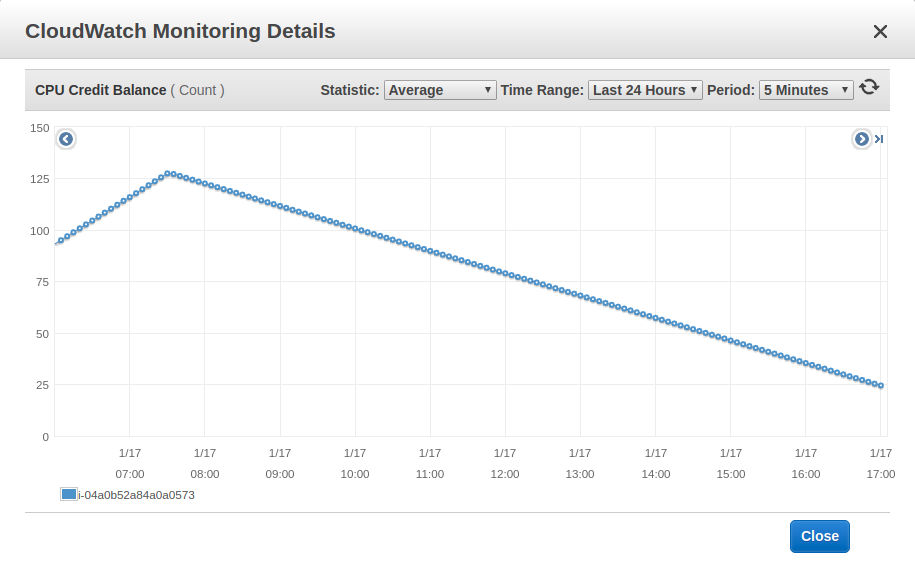
Result shows that t2.medium AWS Instance Type is not able to handle more than 200 requests per second, because of the AWS CPU Credit Balance.
Here is the Credit Balance chart line for the t2.medium during publishing 200 messages per second.
The line goes down and after some period instance will be dramatically decreased by CPU (20% of total).
Test Run #3
| Instance Type | Instance details | Database Type | Device API | Number of devices | Delay between messages in millis | Count of test run hours |
|---|---|---|---|---|---|---|
| t2.medium | 2 vCPUs for a 4h 48m burst, 4GB | PostgreSQL | MQTT | 300 | 1000 ms | 10 |
Test Configuration
Test run configuration (see Performance Test Project for more details):
...
DEVICE_API=MQTT
DEVICE_START_IDX=0
DEVICE_END_IDX=300

PUBLISH_COUNT=36000
PUBLISH_PAUSE=1000
...
CPU/Memory Load
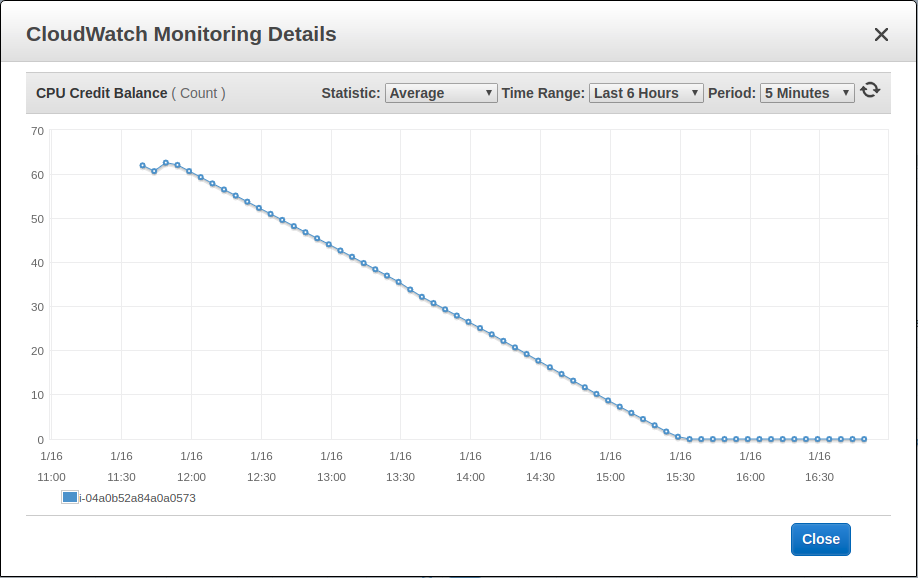
The same results as previous run, but CPU Credit Balance chart line goes down more faster.
c5.large
Performance Results
| Instance Type | Instance details | Database Type | Device API | Number of devices | Delay between messages in millis | Maximum number of messages per second |
|---|---|---|---|---|---|---|
| c5.large | 2 vCPUs , 4GB | PostgreSQL | MQTT | 1100 | 1000 ms | ~1020/sec |
Test run configuration (see Performance Test Project for more details):
...
DEVICE_API=MQTT
DEVICE_START_IDX=0
DEVICE_END_IDX=1100

PUBLISH_COUNT=300
PUBLISH_PAUSE=1000
...
Test Run #1
| Instance Type | Instance details | Database Type | Device API | Number of devices | Delay between messages in millis | Count of test run hours |
|---|---|---|---|---|---|---|
| c5.large | 2 vCPUs, 4GB | PostgreSQL | MQTT | 500 | 1000 ms | 10 |
Test Configuration
Test run configuration (see Performance Test Project for more details):
...
DEVICE_API=MQTT
DEVICE_START_IDX=0
DEVICE_END_IDX=500

PUBLISH_COUNT=36000
PUBLISH_PAUSE=1000
...
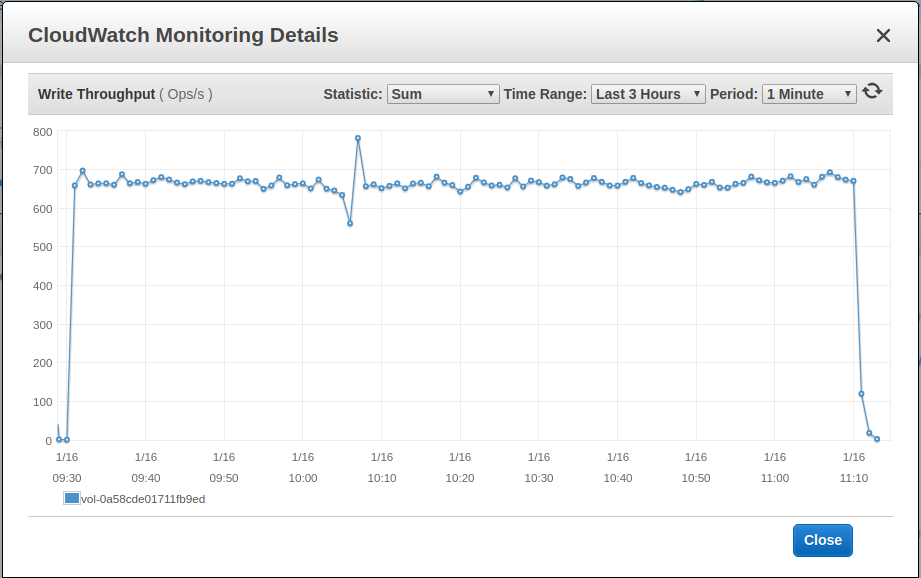
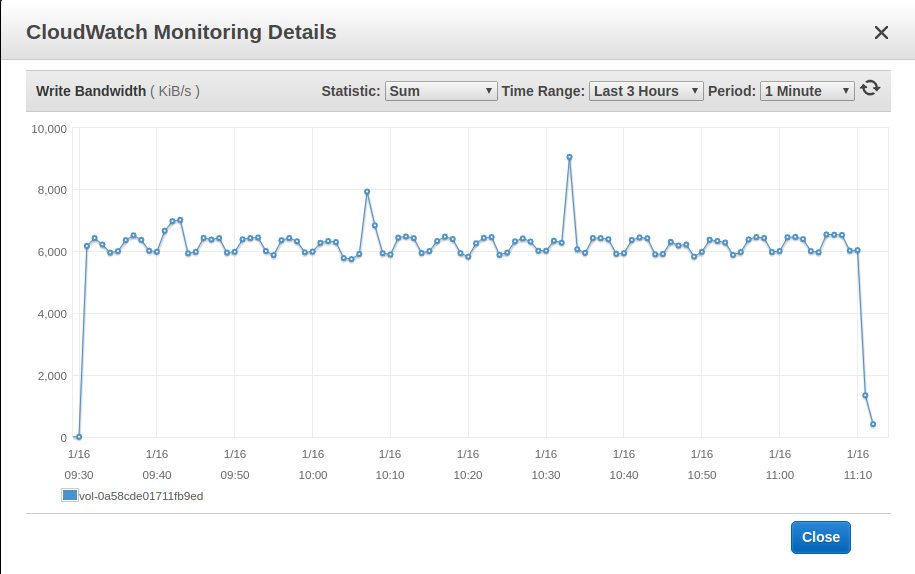
CPU/Memory Load
c5.large AWS instance does not have CPU burst that why CPU Credit Balance is not applicable to verify in this case.
But to be able to support 500 requests per seconds correct volume must be provisioned - with enough IOPS limits.
For the PostgreSQL database, 500 requests per seconds are equal to ~500 IOPS.
So AWS volume for this test must be provisioned with at least 600 IOPS.
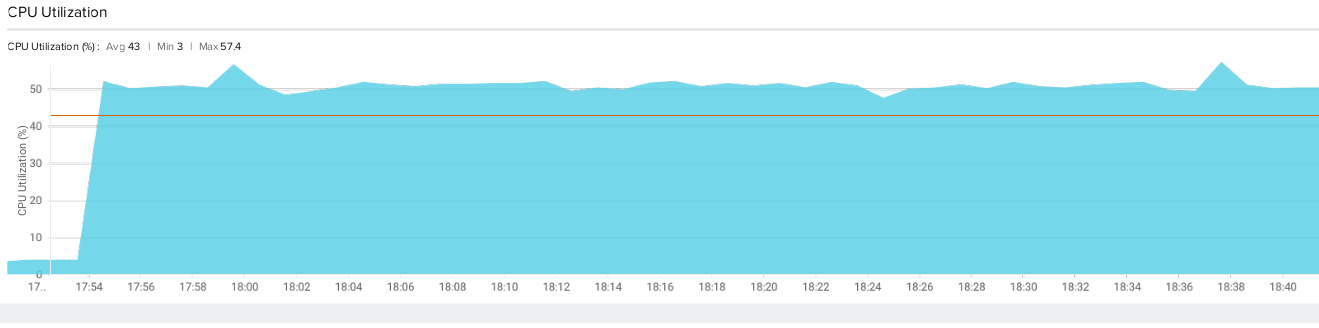
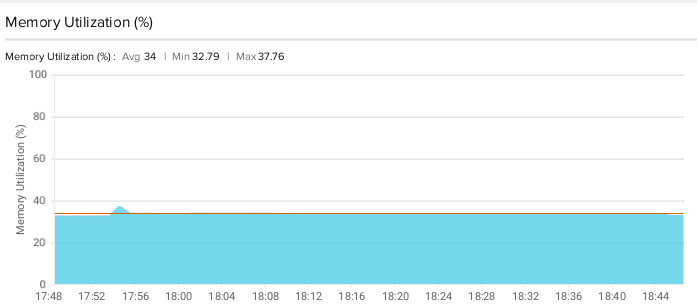
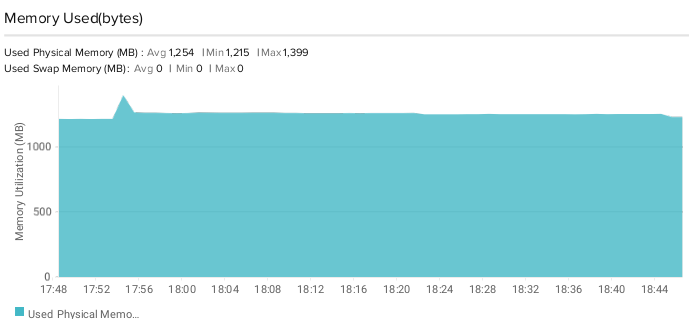
| Property | Avg | Min | Max |
|---|---|---|---|
| CPU Utilization (%) | 48 | 3 | 57.4 |
| Memory Utilization (%) | 34 | 32.79 | 37.76 |
| Used Physical Memory (MB) | 1254 | 1215 | 1399 |
CPU Utilization (%)
Memory Utilization (%)
Used Physical Memory (MB)
TB dashboard
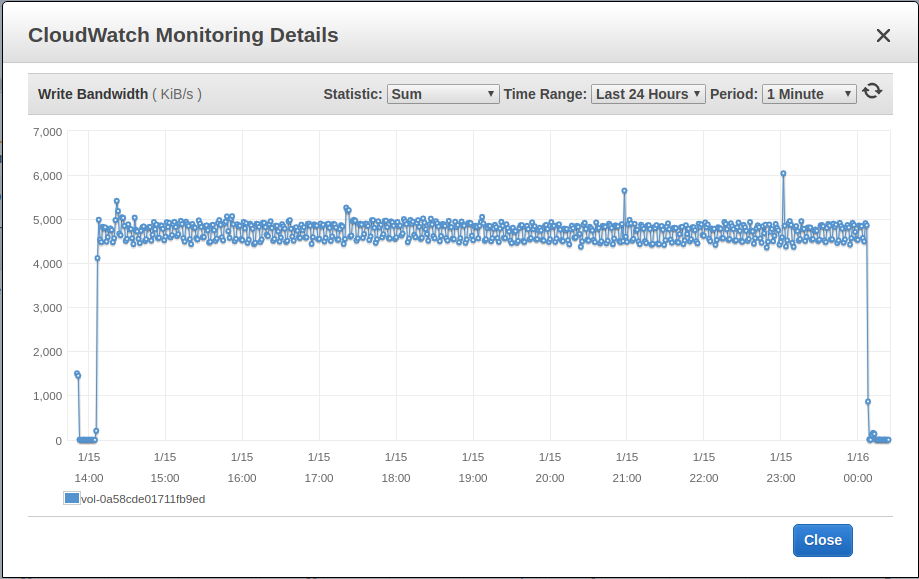
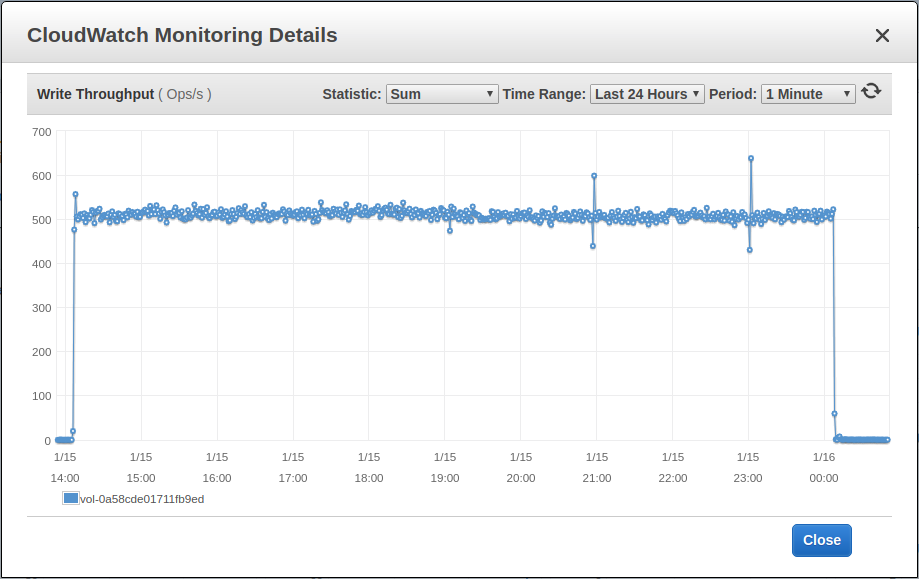
AWS write IOPS for the volume
Test Run #2
| Instance Type | Instance details | Database Type | Device API | Number of devices | Delay between messages in millis | Count of test run hours |
|---|---|---|---|---|---|---|
| c5.large | 2 vCPUs, 4GB | PostgreSQL | MQTT | 700 | 1000 ms | 10 |
Test Configuration
Test run configuration (see Performance Test Project for more details):
...
DEVICE_API=MQTT
DEVICE_START_IDX=0
DEVICE_END_IDX=700

PUBLISH_COUNT=36000
PUBLISH_PAUSE=1000
...
CPU/Memory Load
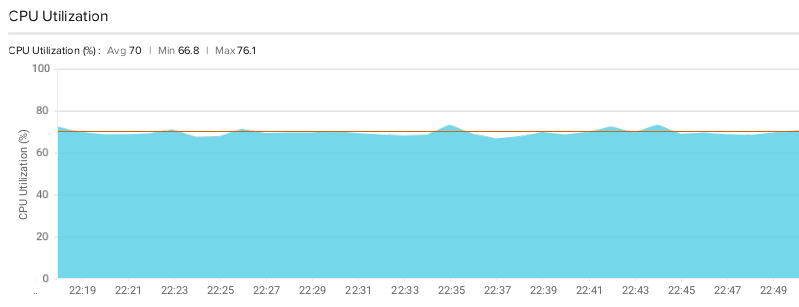
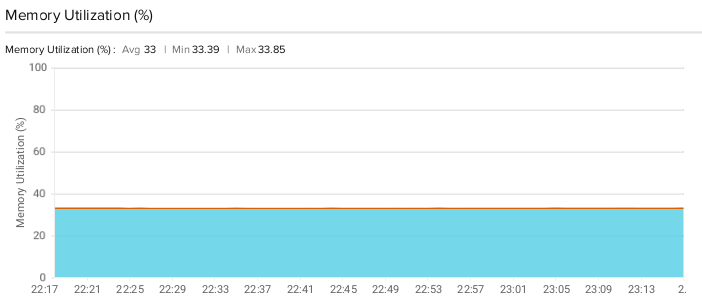
| Property | Avg | Min | Max |
|---|---|---|---|
| CPU Utilization (%) | 70 | 66.8 | 76.1 |
| Memory Utilization (%) | 33 | 33.39 | 33.85 |
| Used Physical Memory (MB) | 1241 | 1237 | 1254 |
CPU Utilization (%)
Memory Utilization (%)
Used Physical Memory (MB)
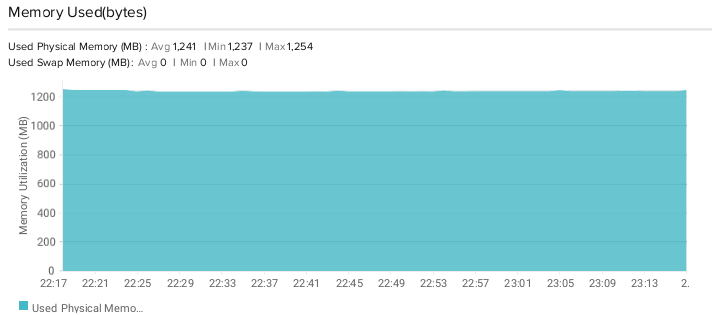
TB dashboard
AWS write IOPS for the volume
m5.xlarge
Performance Results
| Instance Type | Instance details | Database Type | Device API | Number of devices | Delay between messages in millis | Maximum number of messages per second |
|---|---|---|---|---|---|---|
| m5.xlarge | 4 vCPUs, 16GB, 150GB SSD mounted | Cassandra | MQTT | 3500 | 1000 ms | ~3500/sec |
Test run configuration (see Performance Test Project for more details):
...
DEVICE_API=MQTT
DEVICE_START_IDX=0
DEVICE_END_IDX=3500

PUBLISH_COUNT=300
PUBLISH_PAUSE=1000
...
| Instance Type | Instance details | Database Type | Device API | Number of devices | Delay between messages in millis | Maximum number of messages per second |
|---|---|---|---|---|---|---|
| m5.xlarge | 4 vCPUs, 16GB, 150GB SSD mounted | Cassandra | HTTP | 2000 | 1000 ms | ~950/sec |
Test run configuration:
...
DEVICE_API=HTTP
DEVICE_START_IDX=0
DEVICE_END_IDX=2000

PUBLISH_COUNT=300
PUBLISH_PAUSE=1000
...
Test Run #1
| Instance Type | Instance details | Database Type | Device API | Number of devices | Delay between messages in millis | Count of test run hours |
|---|---|---|---|---|---|---|
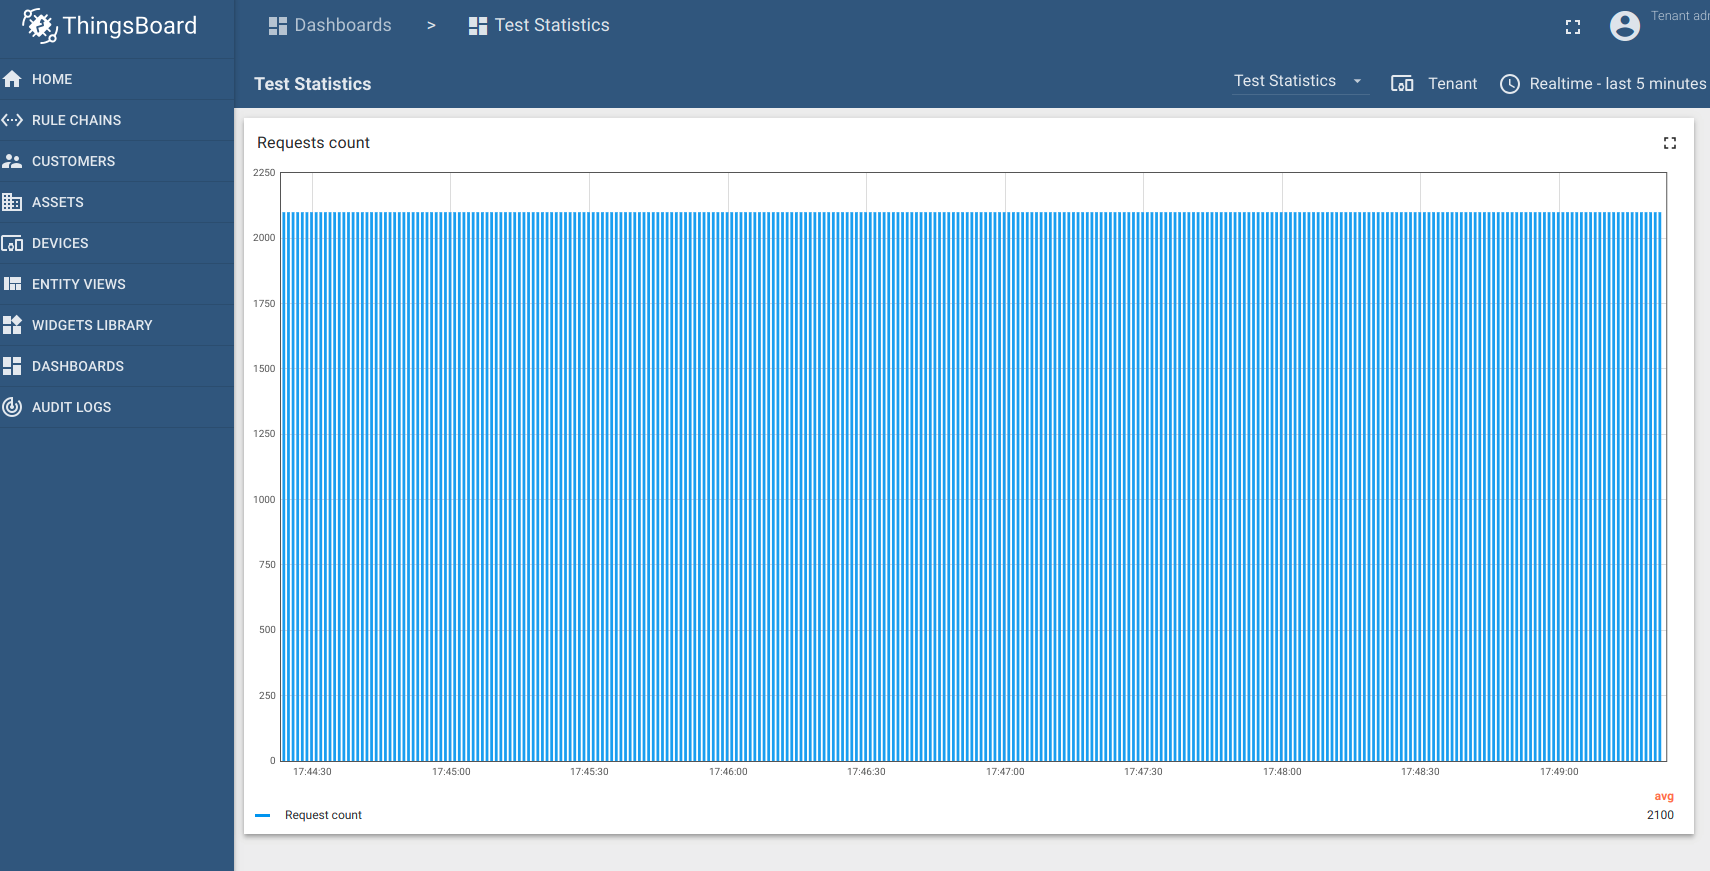
| m5.xlarge | 4 vCPUs, 16GB | Cassandra | MQTT | 2100 | 1000 ms | 10 |
Test Configuration
Test run configuration (see Performance Test Project for more details):
...
DEVICE_API=MQTT
DEVICE_START_IDX=0
DEVICE_END_IDX=2100

PUBLISH_COUNT=36000
PUBLISH_PAUSE=1000
...
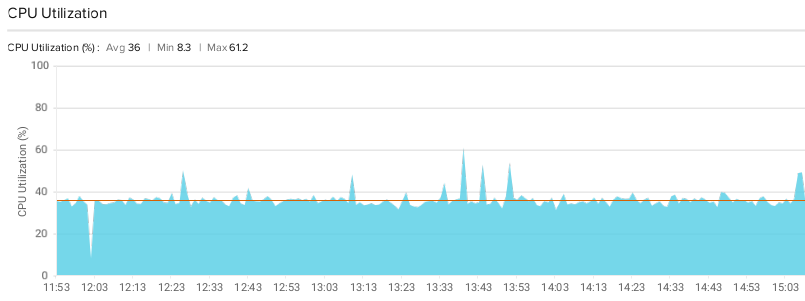
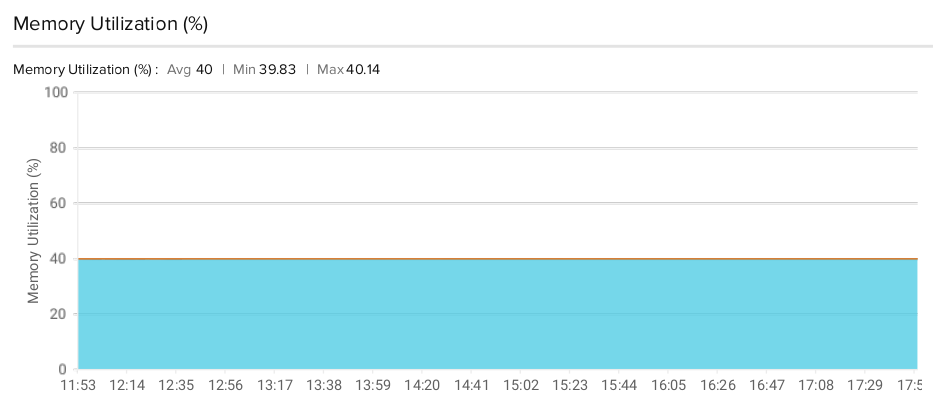
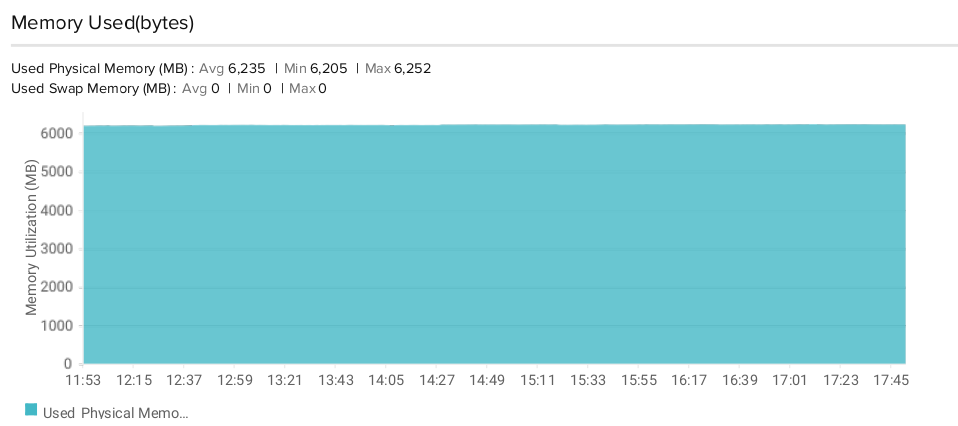
CPU/memory load
| Property | Avg | Min | Max |
|---|---|---|---|
| CPU Utilization (%) | 36 | 8.3 | 61.2 |
| Memory Utilization (%) | 40 | 39.83 | 40.14 |
| Used Physical Memory (MB) | 6235 | 6205 | 6252 |
CPU Utilization (%)
Memory Utilization (%)
Used Physical Memory (MB)
TB dashboard