Tables
- Simple Table
- Table With Dynamic Columns
- Table with Individual Time Range for Column
- Default Sorting
- Cell Colors
Simple Table
In this mode, you drag-n-drop fields only to the Columns section. Each field represents a column in the table. You can sort and filter rows, change columns order, etc.
Telemetry fields aggregation:
- If there is no Date field in column list - Trendz will apply aggregation function for the whole time range.
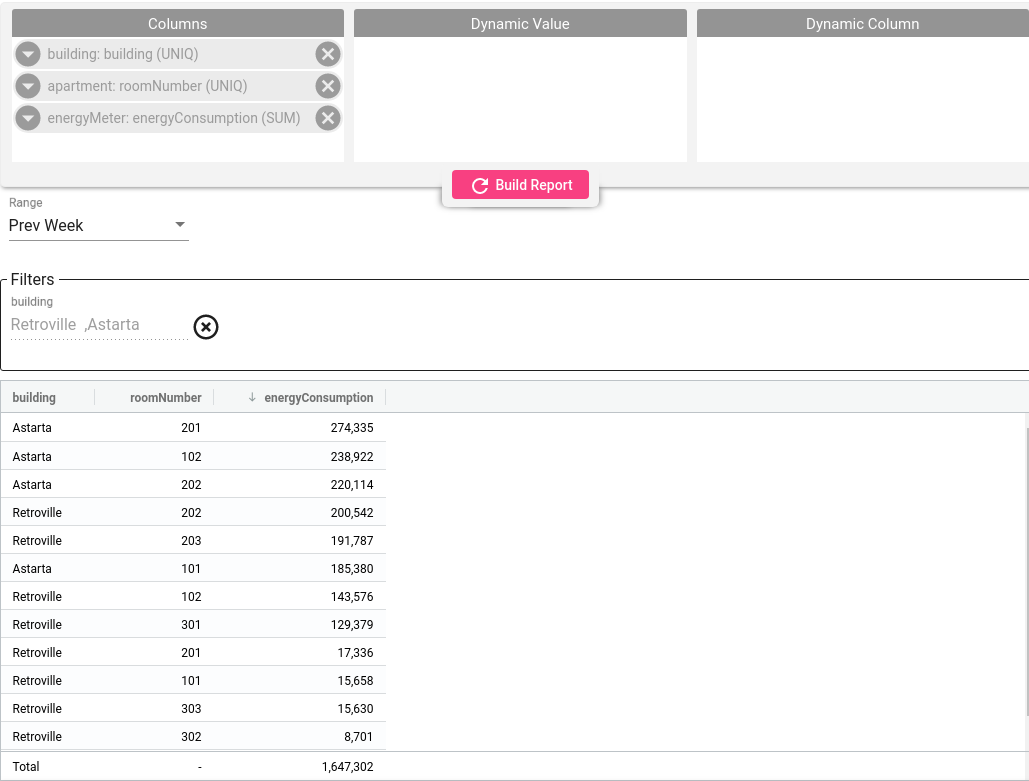
- If Date field present in the column list - system will split time range into multiple time ranges and apply aggregation to each range separately.
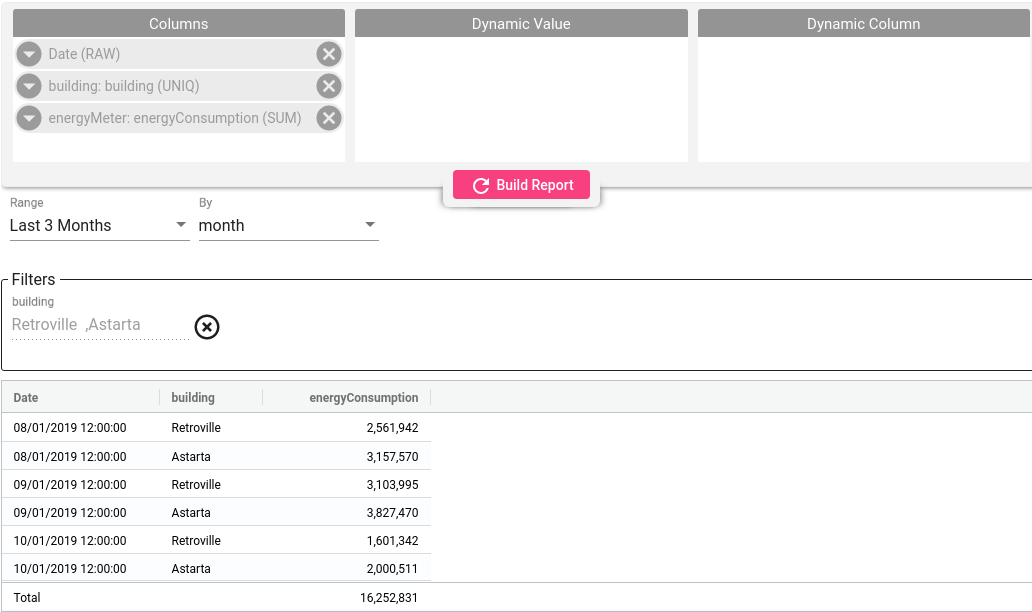
Table With Dynamic Columns
This table modification allows showing telemetry aggregation as additional columns instead os separate rows. For making it - add the telemetry field into Dynamic Value section and Date field into Dynamic Column section with required date grouping.
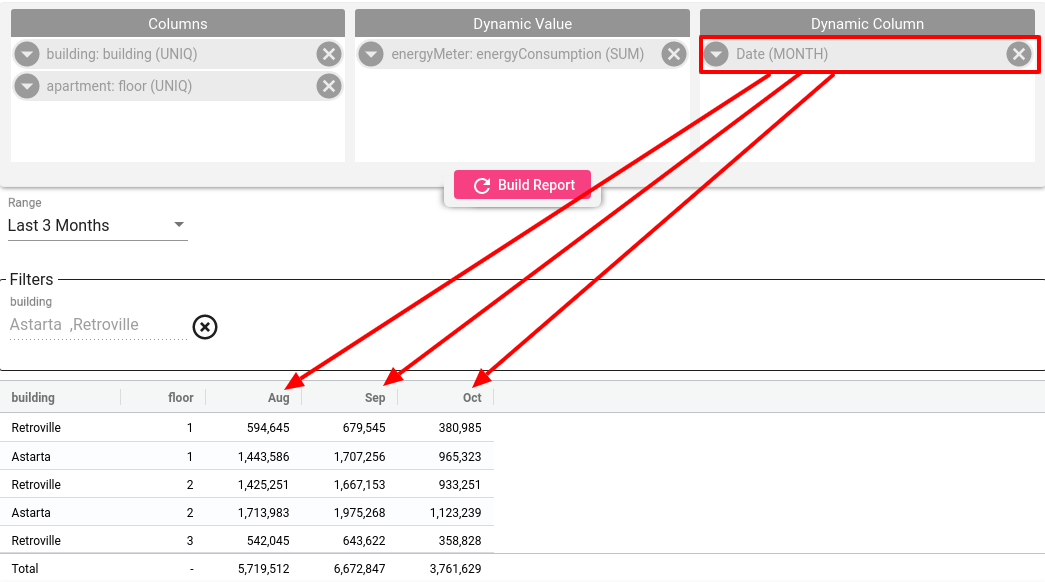
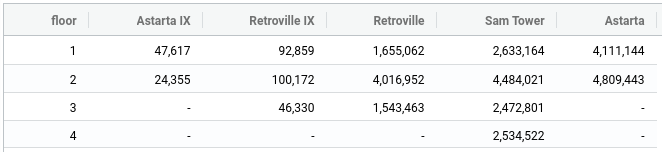
You can add any field (date/attribute) into the Dynamic Column section to build required table. Here is an example when we want to show consumption for each building as a separate column and floor represent a row.
Note that when Dynamic Columns used only one field allowed in the Dynamic Value and Dynamic Column section. If multiple fields added to one of those sections - table will be blank. In the same time you still allowed to add multiple fields into Columns section
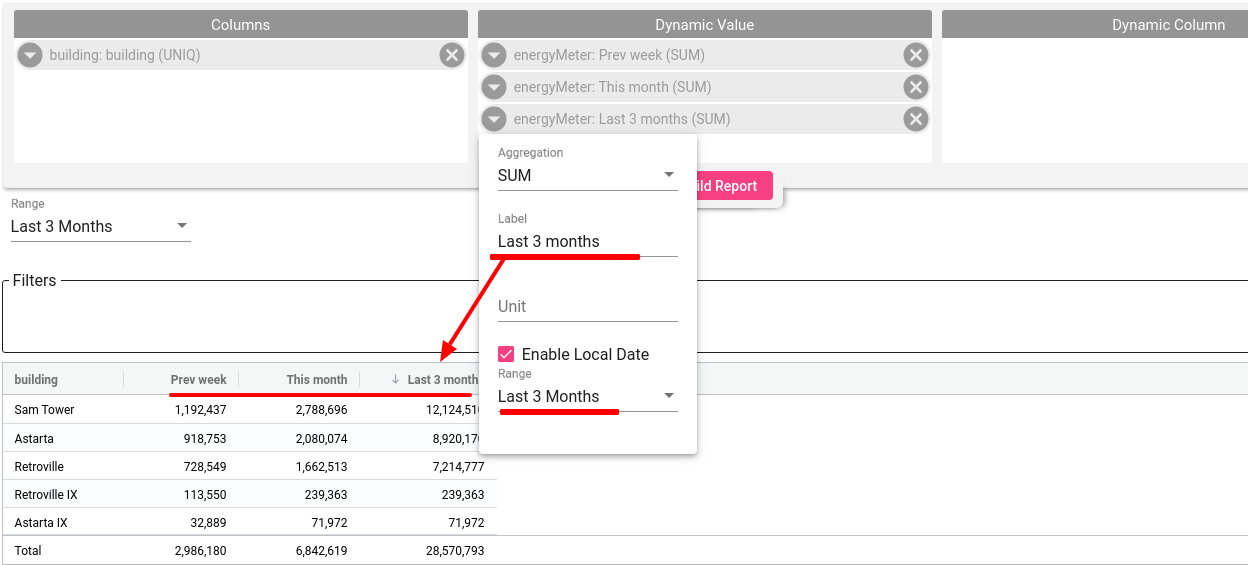
Table with Individual Time Range for Column
To see a bigger picture sometimes is useful to compare different time ranges for the same entity. For example, we want to know what is today consumption, yesterday and for the last month. In this case, we add the telemetry field into Dynamic Value section, enable and select local date for the field and leave Dynamic Column section empty. Note that we can add same telemetry field few times with different local dates.
Default Sorting
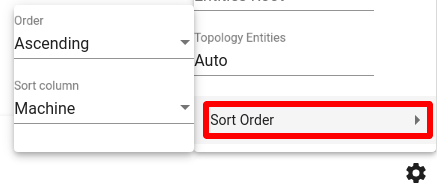
For the rapid distinction of the raw data, while building the table, you can configure the sorting order for the columns.
To define sorting order to the column:
- navigate to the Setting section
- choose the column and apply the order for sorting: descending or ascending
Cell Colors
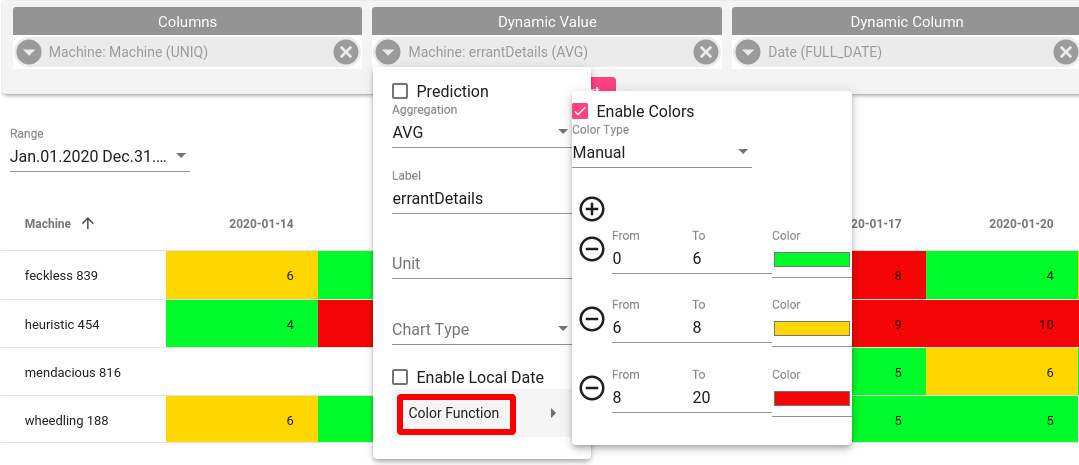
Use color rules to apply colors to cells based on their values.
On the card of chosen telemetry, activate Color function and choose color type: Auto or Manual. You can create multiple custom color ranges.
- Select field that should be colored
- Open Color Function menu
- Enable Colors
- Choose color type: Auto or Manual
Trendz supports two types of color rules you can apply:
- Auto Color Rule - Automatically divides the range of data into four grades and apply colors accordingly.
- Manual Color Rule - Applies a specific color to a set range of values.
Total Row
Total row shown on the bottom of the table when aggregation type for the field is SUM or COUNT. In this case system will sum all cell values for each column and show total value.