SODAQ Universal Tracker telemetry upload

|
ThingsBoard PE Feature Only ThingsBoard Professional Edition supports Platform Integrations feature. See ThingsBoard PE Installation Options to install ThingsBoard PE. |
This guide contains step-by-step instruction how to to connect your SODAQ NB-IoT boards to ThingsBoard Professional Edition (PE) through the T-Mobile NB IoT network. We will use free ThingsBoard PE demo server cloud.thingsboard.io in this guide. This guide will be useful for anyone who wants to connect their SODAQ NB-IoT boards or other hardware to T-Mobile NB IoT network.
- Prerequisites
- Integration overview
- Step 1. Data Converter configuration
- Step 2. Integration configuration
- Step 3: Post telemetry and verify the Integration configuration
- Step 4: T-Mobile NB-IoT Platform Callback configuration
- Step 5: Check Integration Debug Events
- Step 6: Rule chain import
- Step 7: Demo dashboard import
- Advanced Configuration (Optional)
- Next steps
Prerequisites
We assume you have at least one of SODAQ NB-IoT Trackers in your lab that is already connected to your T-Mobile IoT network. We also assume you already have a ThingsBoard PE server or free demo account. Otherwise you can register for a 30-days free demo account here: cloud.thingsboard.io.
We expect you to have a very basic knowledge about ThingsBoard, so we do recommend to complete the Getting Started guide.
Integration overview
ThingsBoard Platform Integrations feature allows to push data from various platforms and connectivity solutions to ThingsBoard. We will use “T-Mobile IoT CDP” platform integration to consume data from T-Mobile NB IoT Network and automatically register devices in ThingsBoard. Besides configuring the integration, we will also setup ThingsBoard to decode incoming data, store it in the database, visualize on the dashboard and generate alarms based on configurable thresholds.
Step 1. Data Converter configuration
In order to create an Integration, we should create the Uplink Data Converter first. The converter will decode incoming telemetry payload data from T-Mobile NB IoT that contains in encoded hex string to human readable, simplified ThingsBoard data format.
- Input data from T-Mobile NB IoT Platform looks like this:
{
    "reports": [{
        "serialNumber": "IMEI:0123456789",
        "timestamp": 1547035621977,
        "subscriptionId": "43524b52-b924-40f0-91f0-e7fa71dca87b",
        "resourcePath": "uplinkMsg/0/data",
        "value": "010145292a2bfbfc0000000000000000e6e3355c751a879de31e6535d10306005600d00402"
    }]
}- After decoding output data will look like this:
{
    "deviceName": "0123456789",
    "deviceType": "tracker",
    "telemetry": [{
        "ts": 1547035622000,
        "values": {
            "batteryVoltage": 4.17,
            "temperature": 26,
            "latitude": 51.8233479,
            "longitude": 6.4042341,
            "altitude": 6,
            "speed": 86,
            "satellitesObserved": 208,
            "timetToFirstFix": 4
        }
    }]
}
Few things to notice:
- The IMEI from the incoming message will become the Device Name in ThingsBoard;
- ThingsBoard will automatically create device with type “tracker” and name equal to IMEI;
-
Timestamp and sensor readings are decoded from incoming hex string.
- The following table shows the first byte position and the number of bytes for each encoded field that includes in the incoming hex string:
| Field | First Byte | Byte length |
| ts | 16 | 4 |
| batteryVoltage | 20 | 1 |
| temperature | 21 | 1 |
| latitude | 22 | 4 |
| longitude | 26 | 4 |
| altitude | 30 | 2 |
| speed | 32 | 2 |
| satellitesObserved | 35 | 1 |
| timetToFirstFix | 36 | 1 |
-
Go to Data Converters -> Add new Data Converter -> Import Converter
-
Import following json file: SODAQ Uplink data converter (left click on the link and then ‘Ctrl+S’ to download) as described on the following screencast:
Step 2. Integration configuration
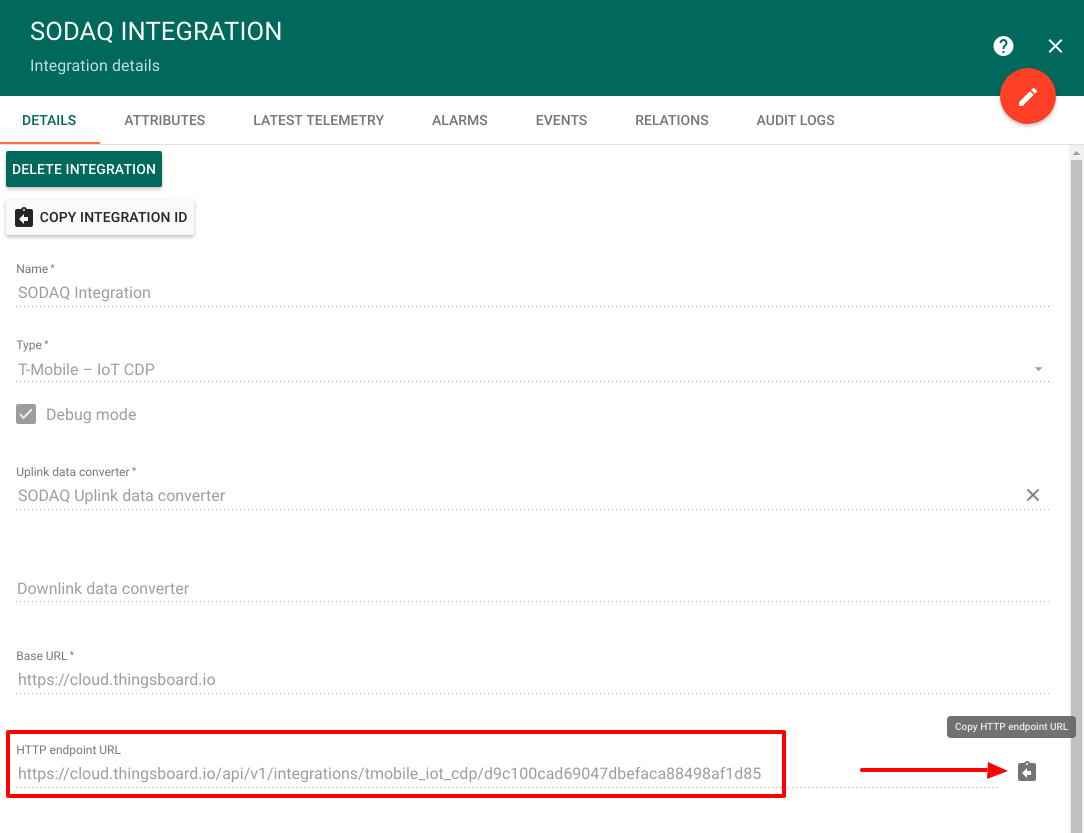
- Create new integration and copy-paste the HTTP Endpoint URL from the integration window based on the screencast below:
- Fill in the fields with the input data shown in the following table:
| Field | Input Data |
| Name | SODAQ Integration |
| Type | T-Mobile – IoT CDP |
| Debug mode | True |
| Uplink data converter | SODAQ Uplink data converter |
| Downlink data converter | (empty) |
| Base URL | https://THINGSBOARD_URL |
| HTTP endpoint URL | https://THINGSBOARD_URL/api/v1/integrations/tmobile_iot_cdp/$ROUTING_KEY |
- After filling all fields click the ADD button.
Step 3: Post telemetry and verify the Integration configuration
Before we rush to T-Mobile IoT platform configuration, let’s make sure ThingsBoard is properly configured using simple cURL command. We will be simulating message from the T-Mobile IoT platform using command below. Please note that we will use the HTTP Endpoint URL from a Step 2.
For this we will need to copy HTTP endpoint URL from the SODAQ Integration.
Download the attached json file with telemetry data and execute the following command:
curl -v -X POST -d @telemetry-data.json $HTTP_ENDPOINT_URL --header "Content-Type:application/json"

**you need to replace $HTTP_ENDPOINT_URL with actual HTTP endpoint URL**
Device should be created:
Now you can delete this dummy device if needed.
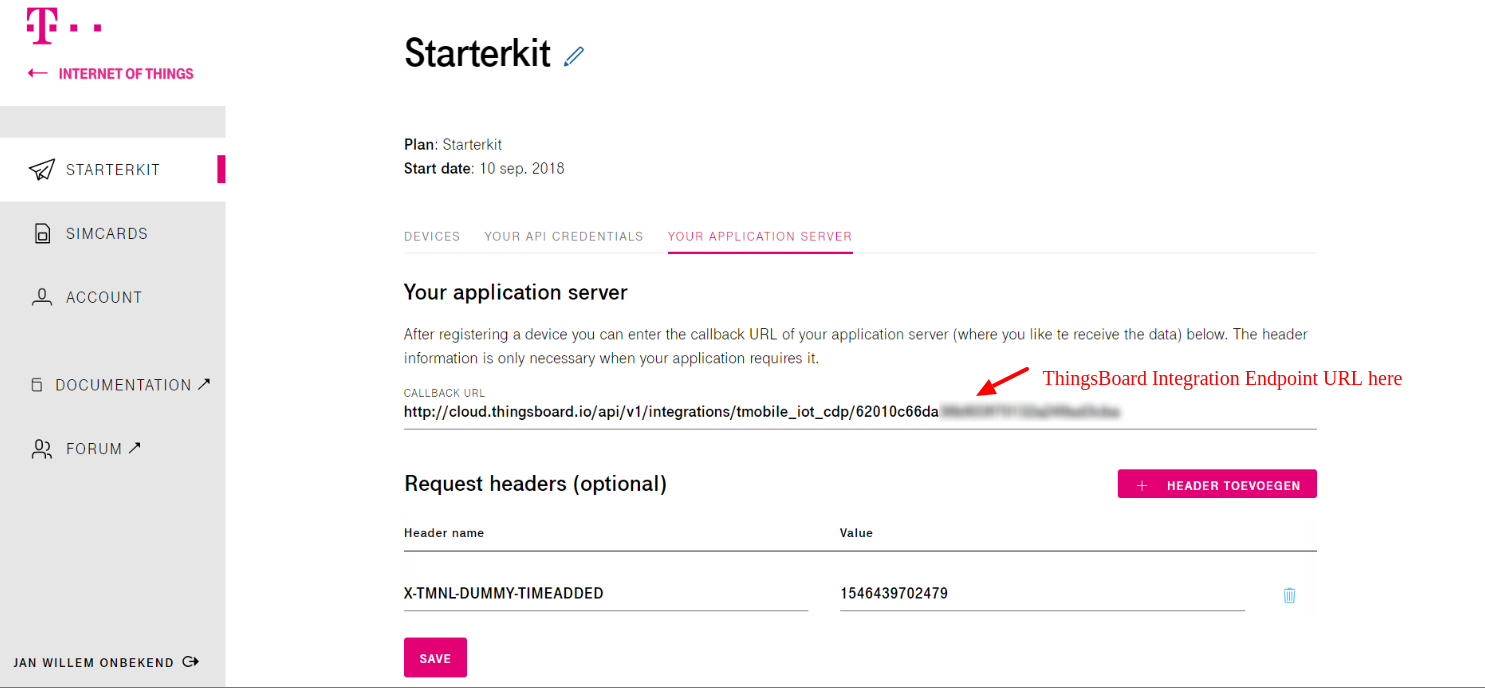
Step 4: T-Mobile NB-IoT Platform Callback configuration
Use HTTP endpoint URL from Step 2 to configure T-Mobile Platform to push data to this URL. See image below for reference.
Step 5: Check Integration Debug Events
Navigate to Integration Debug Events, similar to Step 3 and double check that data from real devices arrives and is processed successfully. Please note that it may take some time (up to 30 minutes based on our experience) for new message to start arriving.
Step 6: Rule chain import
In this tutorial, we modified our Root Rule Chain and also created Rule Chain Tracker Alarms. The idea is to forward all incoming telemetry, once it is saved to the database, to Tracker Alarms rule chain. This rule chain lookup individual alarm threshold parameters for each tracker. User is able to configure those parameters in the dashboard.
Download the attached json file for the Tracker Alarms chain.
The following screencast will show how to import and configure rule chains:
Step 7: Demo dashboard import
Download and import attached json file with a dashboard from this tutorial.
The following screencast will show how to import the dashboard:
After Dashboard creation navigate to Tracker details state to sets the limit values, namely:
- Max Speed
- Min Voltage
- Min Temperature
- Max Temperature
Once Rule chains and Dashboard set up you can trigger device to post the real data and verify that Integration and Rule chains work as expected. Advanced configuration guide below demonstrates step-by-step instruction how to configure the rule chains and how they actually work. This steps are optional and we recommend to navigate to Next Steps for beginners.
Advanced Configuration (Optional)
Security
Note that you can add additional HTTP headers with some unique parameters for security. For example, you can add “MY-INTEGRATION-AUTH-HEADER” with some random string value to both Integration configuration (Step 2) and T-Mobile configuration (Step 4). Obviously, those headers should match for data flow to work properly.
Message flow
In this section, we explain the purpose of each node in this tutorial:
- Node A: Originator attributes node.
- This node add Message Originator Attributes (client\shared\server scope) and Latest Telemetry value into Message Metadata.
- Node B, C, D, E: Filter Script nodes.
- These nodes with different threshold test scripts. The particular script will return ** true ** if the condition is executed, otherwise, it will return ** false ** “.- Node B: Create alarm node.
- Node F, H, G, L: Create alarm nodes.
- Creates or Updates an alarm if the specific published telemetry is not at expected range (filter script node returns True).
- Node G, I, K, M: Clear alarm node.
- Clears alarm if it exists in case if the specific published telemetry is in an expected range (filter script node returns False).
- Node O: Rule Chain node.
- Forwards incoming Message to specified Rule Chain Create & Clear Alarms.
Configuring the Rule Chain
In this tutorial, we modified our Root Rule Chain and also created Rule Chain Tracker Alarms
The following screenshots show how the above Rule Chains should look like:
- Tracker Alarms:
![]()
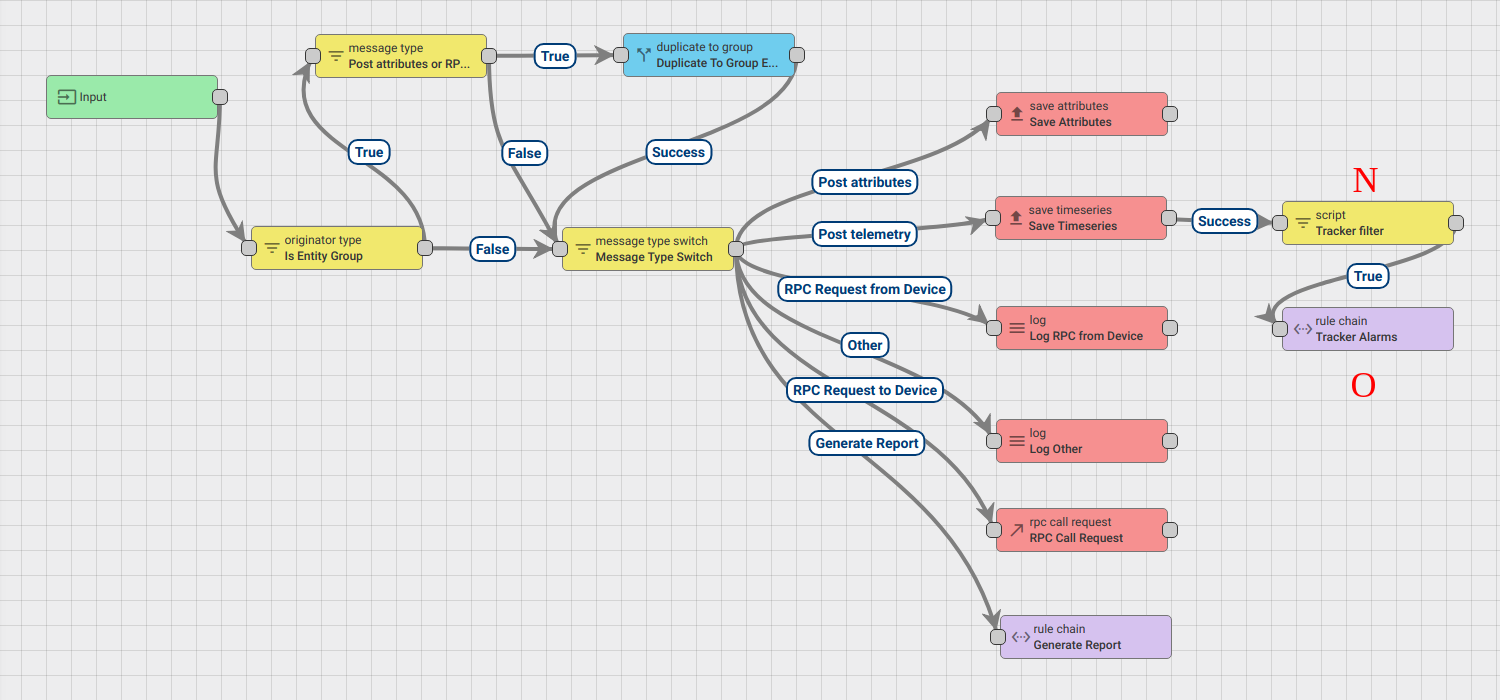
- Root Rule Chain:
Download the attached json file for the Tracker Alarms chain.
The following sections shows you how to create Tracker Alarms chain from scratch and modify Root Rule Chain.
Create new Tracker Alarms Rule Chain
Go to Rule Chains -> Add new Rule Chain
Configuration:
- Name : Tracker Alarms
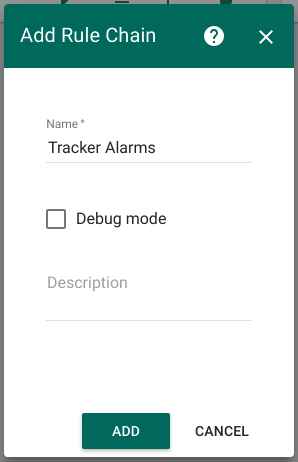
New Rule Chain is created. Press Edit button and to configure it.
Adding the required nodes
In this rule chain, you will create 13 nodes as it will be explained in the following sections:
Node A: Originator attributes
-
Add the Originator attributes node and connect it to Input node.
This node will be used for taking shared scope attributes of the message originator that will be setts directly from the Dashboard. -
Fill in the fields with the input data shown in the following table:
| Field | Input Data |
| Name | Fetch Limit telemetry |
| Shared attributes | maxTemperature |
| Shared attributes | minTemperature |
| Shared attributes | maxSpeed |
| Shared attributes | minVoltage |
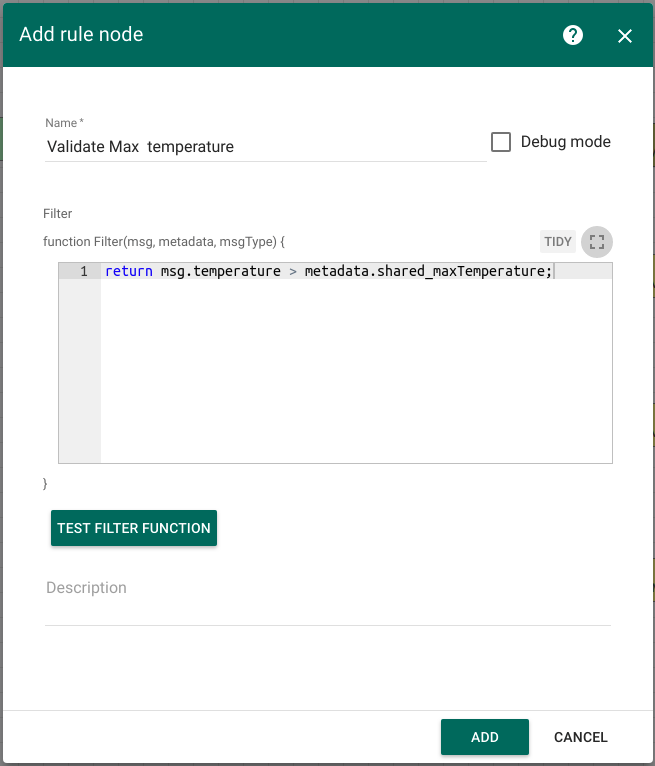
Node B: Filter Script
- Add the Filter Script node and connect it to the Originator attributes node with a relation type Success.
This node will verify: “if the temperature less than max temperature value” using the following script:
return msg.temperature > metadata.shared_maxTemperatureIf the temperature more than max value the script will return true, otherwise false will be returned.
- Enter the Name field as Validate Max temperature.
Rule Nodes C, D, and E have the same configuration that has the above-mentioned rule node.
Paste the JS script code shown in the following table to the corresponding Rule Nodes:
| Rule Node | Script Code |
| C: Validate Min temperature | return msg.temperature < metadata.shared_minTemperature; |
| D: Validate Max speed | return msg.speed > metadata.shared_maxSpeed; |
| E: Validate Min voltage | return msg.batteryVoltage < metadata.shared_minVoltage; |
Node F: Create alarm
-
Add the Create alarm node and connect it to the Filter Script node with a relation type True.
This node loads the latest Alarm with configured Alarm Type for Message Originator
if the published temperature more than maxTemperature value (filter script node returns True). -
Enter the Name field as Max Temperature and the Alarm type as Max Temperature.
-
Alarm Details function:
var details = {};
details.value = msg.temperature;
if (metadata.prevAlarmDetails) {
    details = JSON.parse(metadata.prevAlarmDetails);
}
return details;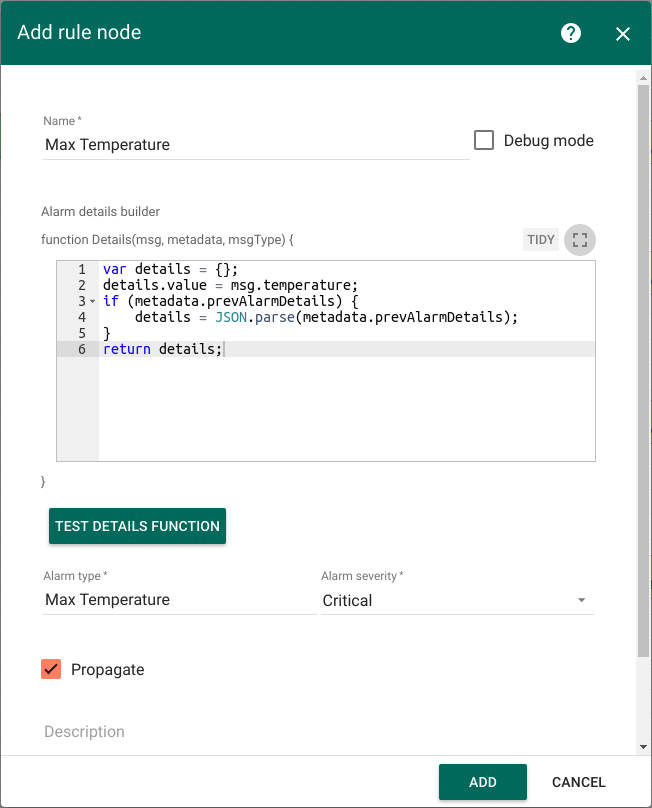
Rule Nodes H, J, and L have the same configuration that has the above-mentioned rule node.
Paste the Alarm Type shown in the following table to the corresponding Rule Nodes:
| Rule Node | Alarm Type | Script Code |
| H: Min temperature | Min temperature |
var details = {};
                      details.value = msg.temperature;
                      if (metadata.prevAlarmDetails) {
                          details = JSON.parse(metadata.prevAlarmDetails);
                      }
return details; |
| J: Max Speed | Max Speed |
var details = {};
                      details.value = msg.speed;
                      if (metadata.prevAlarmDetails) {
                          details = JSON.parse(metadata.prevAlarmDetails);
                      }
return details; |
| L: Min Voltage | Min Voltage |
var details = {};
                      details.value = msg.batteryVoltage;
                      if (metadata.prevAlarmDetails) {
                          details = JSON.parse(metadata.prevAlarmDetails);
                      }
return details; |
Node H: Clear Alarm
-
Add the Clear Alarm node and connect it to the Filter Script node with a relation type False.
This node loads the latest Alarm with configured Alarm Type for Message Originator
and Clears alarm if it exists in case if the published temperature less than maxTemperature value (script node returns False). -
Enter the Name field as Clear Alarm and the Alarm type as Max Temperature.
-
Alarm Details function:
var details = {};
if (metadata.prevAlarmDetails) {
    details = JSON.parse(metadata.prevAlarmDetails);
}
details.clearedValue = msg.temperature;
return details;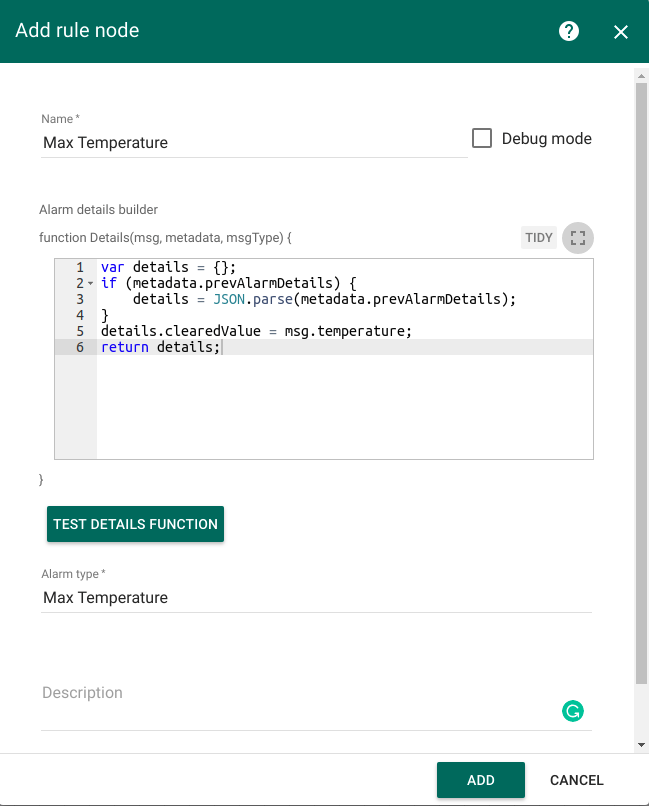
Rule Nodes I, K and M have the same configuration that has the above-mentioned rule node.
Paste the Alarm Type shown in the following table to the corresponding Rule Nodes:
| Rule Node | Alarm Type | Script Code |
| G: Min temperature | Min temperature |
var details = {};
                      if (metadata.prevAlarmDetails) {
                          details = JSON.parse(metadata.prevAlarmDetails);
                      }
                      details.clearedValue = msg.temperature;
                      return details;
|
| I: Max Speed | Max Speed |
var details = {};
                      if (metadata.prevAlarmDetails) {
                          details = JSON.parse(metadata.prevAlarmDetails);
                      }
                      details.clearedValue = msg.speed;
                      return details;
|
| K: Min Voltage | Min Voltage |
var details = {};
                      if (metadata.prevAlarmDetails) {
                          details = JSON.parse(metadata.prevAlarmDetails);
                      }
                      details.clearedValue = msg.batteryVoltage;
                      return details;
|
Modify Root Rule Chain
The initial Root Rule Chain has been modified by adding the following node:
Node A: Filter Script
- Add the Filter Script node and connect it to the Save Timeseries node with a relation type Success.
This node will check that message originator type is correct using the following script:
return metadata.deviceType === 'tracker';- Enter the Name field as Tracker filter.
![]()
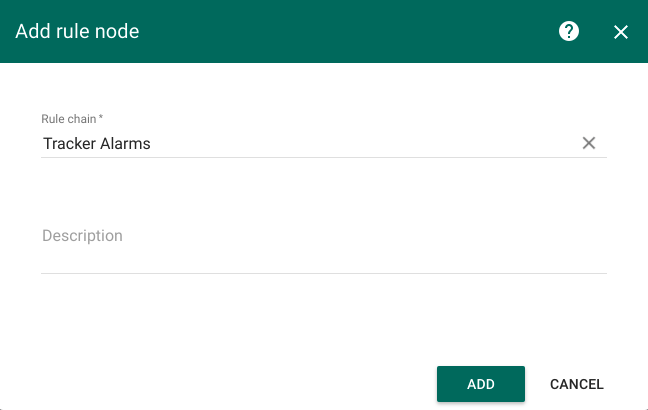
Node O: Rule Chain
-
Add the Rule Chain node and connect it to the Filter Script node with a relation type True.
This node forwards incoming Message to specified Rule Chain Tracker Alarms. -
Enter the Name field as Tracker Alarms.
Next steps
-
Getting started guides - These guides provide quick overview of main ThingsBoard features. Designed to be completed in 15-30 minutes.
-
Installation guides - Learn how to setup ThingsBoard on various available operating systems.
-
Connect your device - Learn how to connect devices based on your connectivity technology or solution.
-
Data visualization - These guides contain instructions how to configure complex ThingsBoard dashboards.
-
Data processing & actions - Learn how to use ThingsBoard Rule Engine.
-
IoT Data analytics - Learn how to use rule engine to perform basic analytics tasks.
-
Advanced features - Learn about advanced ThingsBoard features.
-
Contribution and Development - Learn about contribution and development in ThingsBoard.