Analytics Nodes

|
ThingsBoard PE Feature Only ThingsBoard Professional Edition supports PE Analytics Nodes feature. See ThingsBoard PE Installation Options to install ThingsBoard PE. |
Analytics Nodes that are specific to ThingsBoard PE. Used for analysis of streamed or persisted data.
Aggregate Latest Node
| Since TB Version 2.1 |
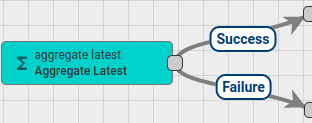
Periodically does aggregation of child entities attributes or latest timeseries for specified set of parent entities.
Performs aggregation of attributes or latest timeseries fetched from child entities with configurable period.
Aggregation result then set to specified target timeseries attribute of parent entity.
Message of type POST_TELEMETRY_REQUEST is generated for each parent entity and aggregated attribute.
Configuration:
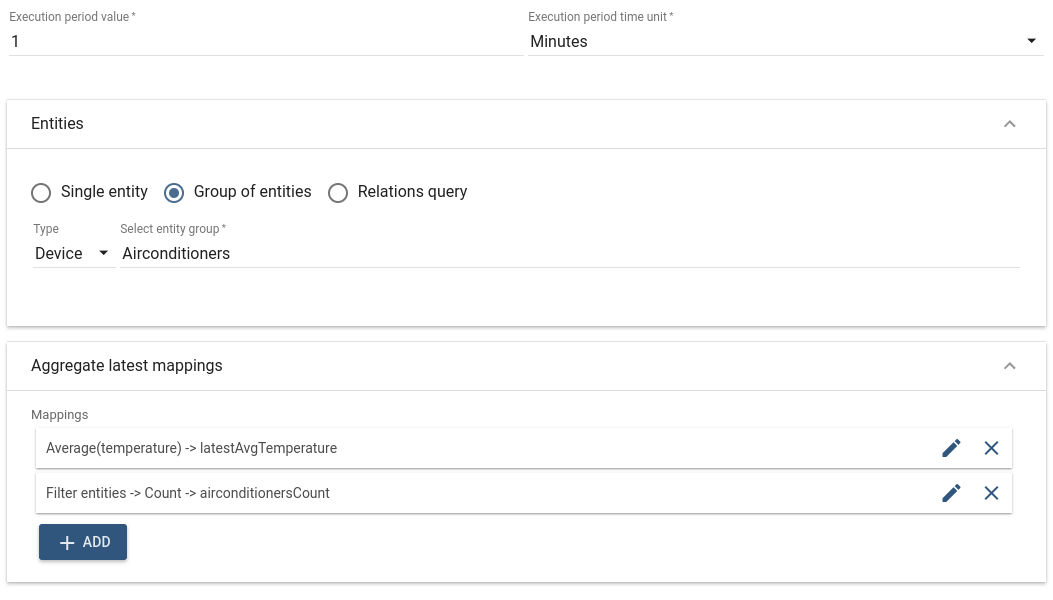
- Execution period value/time unit - specifies period of aggregation task.
- Entities - specifies set of parent entities for which aggregation should be performed. Can be:
- Single entity - one specific entity.
- Group of entities - specific entity group.
- Relations query - set of entities found by Relations query starting from the Root entity.
- Child entities - specifies Relations query used to find child entities starting from the parent entity. Should be specified only when Single entity or Relations query is selected for parent entities. In case of Group of entities child entities selected from the entity group itself.
- Aggregate latest mappings - table of mapping configurations specifying rules of child attributes aggregation.
Mapping Configuration:
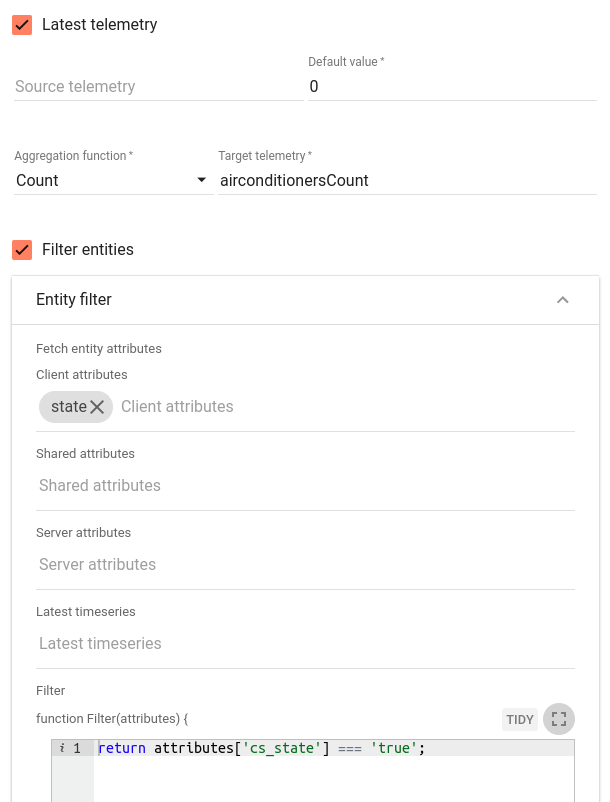
- Latest telemetry - specifies whether value of child latest telemetry or attribute should be aggregated.
- Source telemetry/attribute - child latest telemetry or attribute key name.
- Attribute scope - specifies scope of child attribute in case when attribute used as source (Latest telemetry is unchecked).
- Default value - numeric value used by default in cases when source attribute is not defined or is absent for child entity.
- Aggregation function - mathematical function used for child values aggregation. Can be:
- Minimum - detects minimum attribute value among all child entities.
- Maximum - detects maximum attribute value among all child entities.
- Sum - calculates total sum of attribute values of child entities.
- Average - calculates average value for attribute values of child entities.
- Count - performs count of child entities. In this case Source telemetry/attribute is not used and can be empty.
- Count unique - performs count of unique attribute values of child entities.
- Target telemetry - name of the target telemetry key of parent entity used to store aggregation result.
- Filter entities - whether to perform filtering of child entities before their attribute values aggregation.
- Entity filter - filter used to filter child entities. It has two parts:
- List of entity attribute/latest timeseries keys that should be fetched and used in JavaScript filter function.
- JavaScript filter function that should return filtering result as boolean value.
It receives attributes map containing fetched attributes/latest timeseries values as input argument.
Fetched attribute values are added into attributes map using attribute/latest timeseries keys with scope prefix:
- shared attribute ->
shared_ - client attribute ->
cs_ - server attribute ->
ss_ - telemetry -> no prefix used
- shared attribute ->
For each parent entity node will generate and forward via Success chain new messages of type POST_TELEMETRY_REQUEST, parent entity itself as originator and json body containing target telemetry with aggregated value. In case when aggregation of some child attributes will fail node will generate failure message with failure reason and parent entity as originator. Failure message is forwarded via Failure chain.
Aggregate Stream Node
| Since TB Version 2.1 |
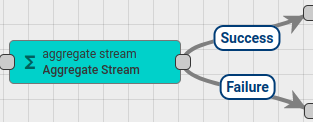
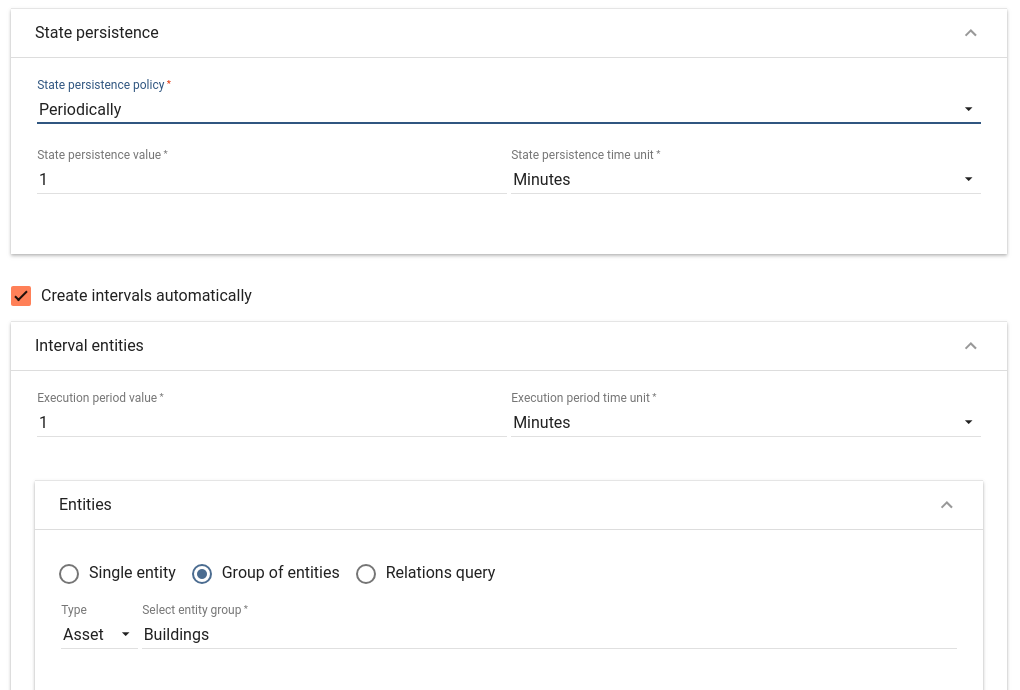
Calculates MIN/MAX/SUM/AVG/COUNT/UNIQUE based on the incoming data stream. Groups incoming data stream based on originator id of the message (i.e. particular device, asset, customer), aggregation function (e.g. “Average”, “Sum”, “Min”, “Max”), aggregation interval value (e.g. 1 minute, 6 hours) into Intervals.
Intervals are periodically persisted based on interval persistence policy and interval check value. Intervals are cached in memory based on Interval TTL value. State of the Intervals are persisted as timeseries entities based on state persistence policy and state persistence value. In case there is no data for certain entity, it might be useful to generate default values for those entities. To lookup those entities one may select Create intervals automatically checkbox and configure Interval entities.
Generates ‘POST_TELEMETRY_REQUEST’ messages with the results of the aggregation for particular interval.
Configuration below will calculate average hourly temperature and will persist it within one minute once the hourly interval is ended. In case some delayed telemetry will arrive for the particular interval, the rule node will lookup it from internal cache or from telemetry values.
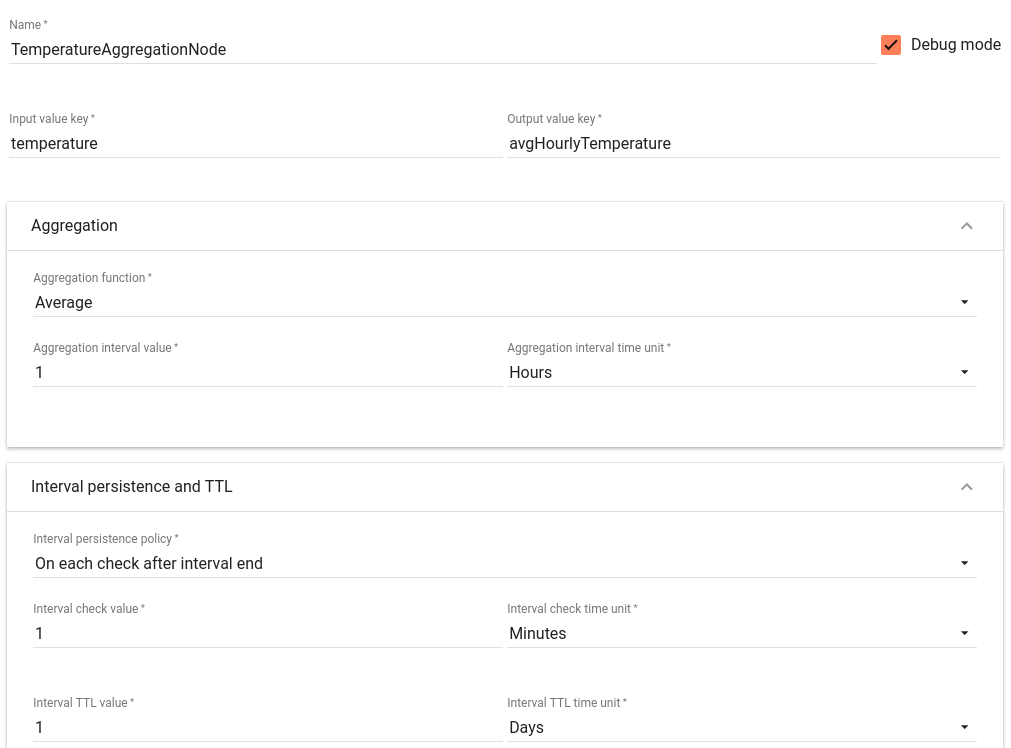
The results of aggregation will be persisted to the database once per minute. Alternatively you can persist the interval on each new message to avoid any data loss in case of server outage. In case devices for some building are not reporting any temperature readings, we can generate default value (zero) for such building on each interval by selecting “Create Intervals automatically” and specifying “Buildings” entity group.
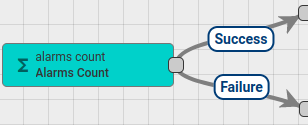
Alarms Count Node
| Since TB Version 2.1 |
Periodically does count of alarms for selected set of entities.
Performs count of alarms for selected entities including their child entities if specified with configurable period.
Result of alarms count then set to specified target timeseries attribute of the entity.
Message of type POST_TELEMETRY_REQUEST is generated for each entity and alarms count result.
Configuration:
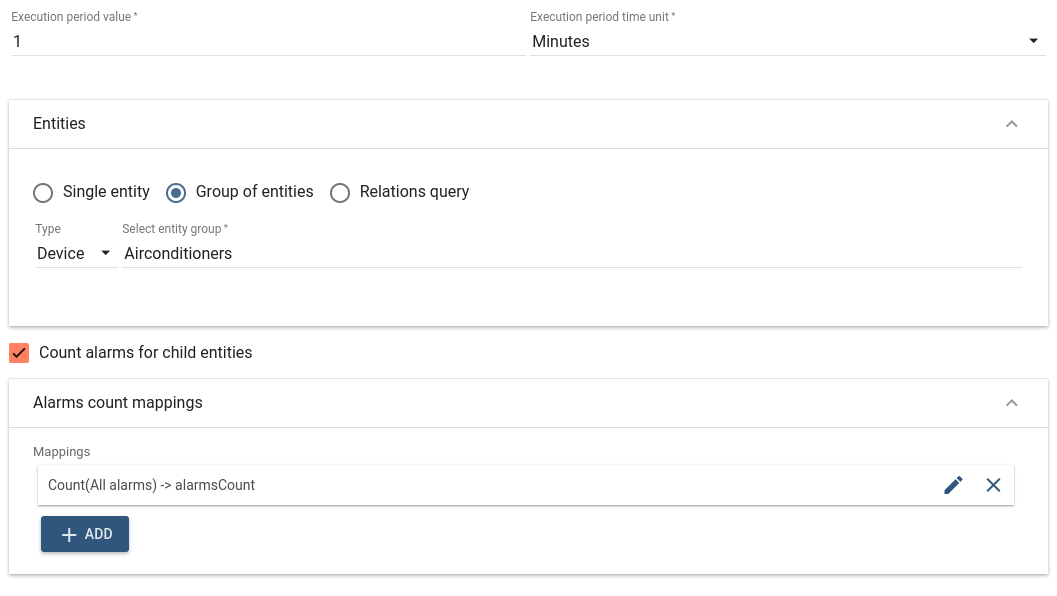
- Execution period value/time unit - specifies period of alarms count task.
- Entities - specifies set of entities for which alarms count should be performed. Can be:
- Single entity - one specific entity.
- Group of entities - specific entity group.
- Relations query - set of entities found by Relations query starting from the Root entity.
- Count alarms for child entities - whether to perform alarms count for child entities of each found entity.
- Child entities - specifies Relations query used to find child entities starting from the parent entity. Should be specified only when Count alarms for child entities is checked and Single entity or Relations query is selected for entities. In case of Group of entities child entities selected from the entity group itself.
- Alarms count mappings - table of mapping configurations specifying rules used to count alarms.
Mapping Configuration:
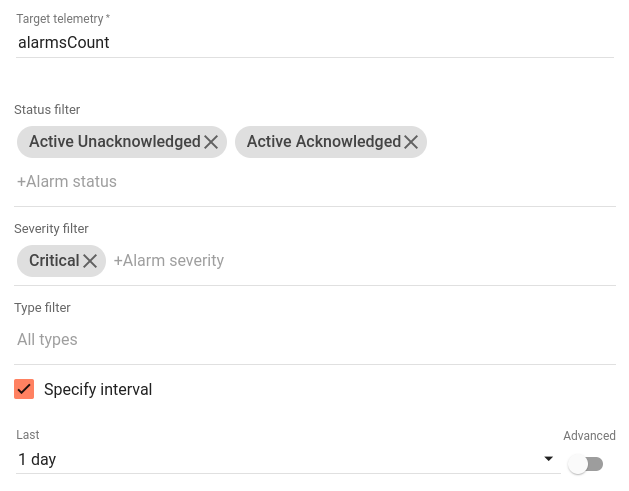
- Target telemetry - name of the target telemetry key of the entity used to store alarms count result.
- Status filter - list of allowed alarm statuses used to filter alarms. If not specified alarms with any status will be selected.
- Severity filter - list of allowed alarm severities used to filter alarms. If not specified alarms with any severity will be selected.
- Type filter - list of allowed alarm types used to filter alarms. If not specified alarms with any type will be selected.
- Specify interval - if checked only alarms created during specified interval will be selected otherwise alarms will be selected for the entire time.
For each selected entity node will generate and forward via Success chain new messages of type POST_TELEMETRY_REQUEST and json body containing target telemetry with alarms count value. In case when alarms count for some entity will fail node will generate failure message with failure reason and entity as originator. Failure message is forwarded via Failure chain.