Aggregate latest telemetry values periodically

|
ThingsBoard PE Feature Only ThingsBoard Professional Edition supports Analytics Rule Nodes feature. See ThingsBoard PE Installation Options to install ThingsBoard PE. |
This tutorial will show how to calculate average temperature in the warehouse based on readings from multiple temperature sensors inside the warehouse.
- Use case
- Prerequisites
- Model definition
- Message Flow
- Configuring the Rule Chains
- Validating the flow
- Next steps
Use case
Let’s assume you have a warehouse with multiple temperature sensors. For example, one per each zone. Let’s also assume temperature readings are reported by the sensor only when it detects temperature change. Thus, some sensors may have been inactive for a week although some sensors may report temperature change just recently.
In this tutorial we will configure ThingsBoard Rule Engine to automatically calculate average temperature in the warehouse based on latest readings from multiple temperature sensors every minute. Please note that this is just a simple theoretical use case to demonstrate the capabilities of the platform. You can use this tutorial as a basis for much more complex scenarios.
We will use 1 warehouse, 2 sensors and 1 minute execution period just for demo purposes.
Prerequisites
We assume you have completed the following guides and reviewed the articles listed below:
- Getting Started guide.
- Rule Engine Overview.
Model definition
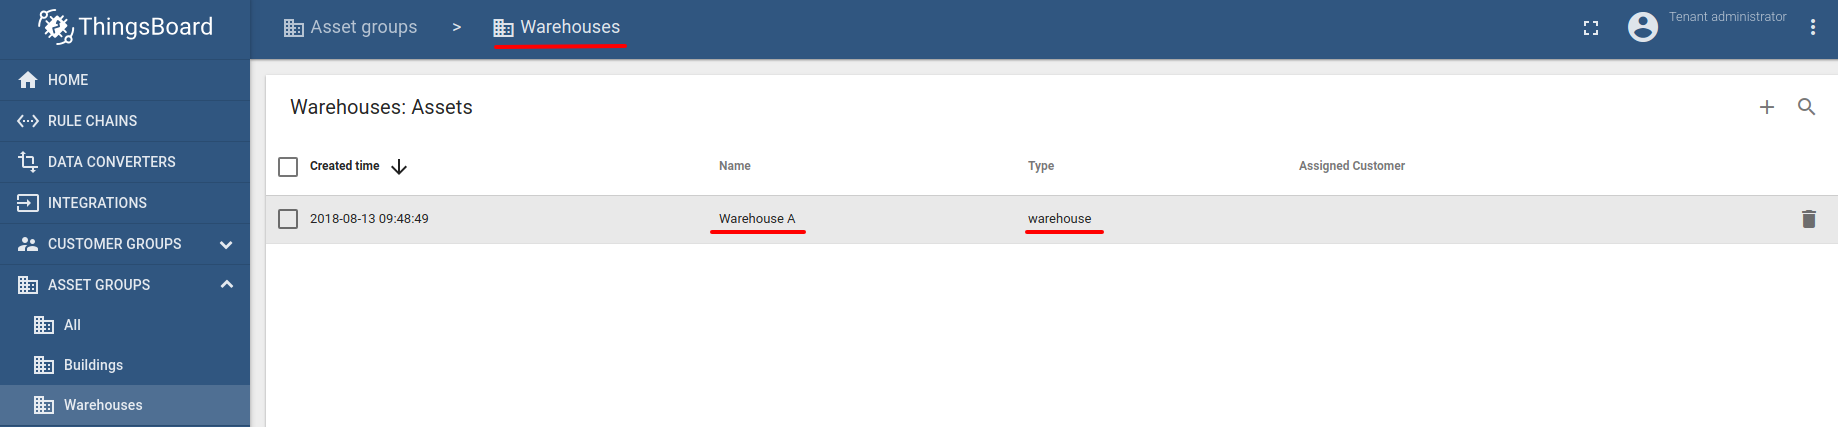
We will create one asset that has name “Warehouse A” and type “warehouse”. We will add this asset to an asset group called “Warehouses”.
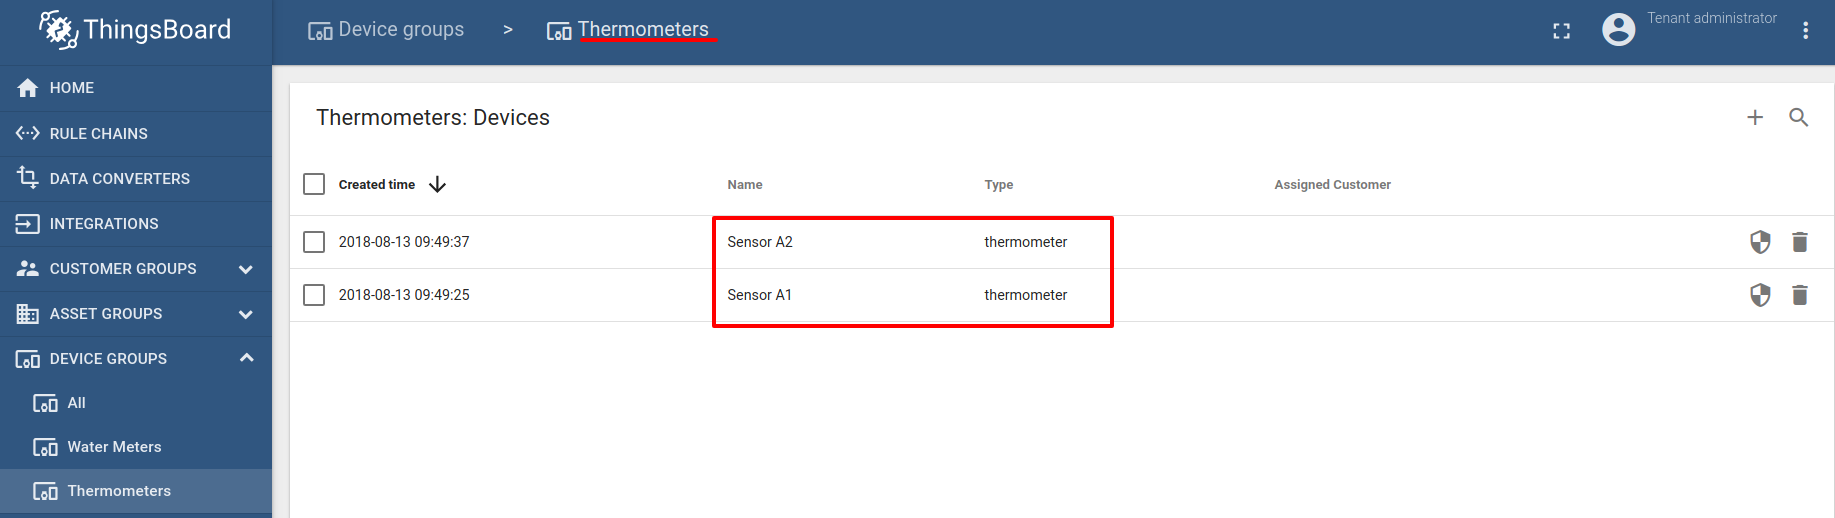
We will create two devices that has names “Sensor A1” and “Sensor A2” and type “thermometer”. We will add this devices to device group called “Thermometers”.
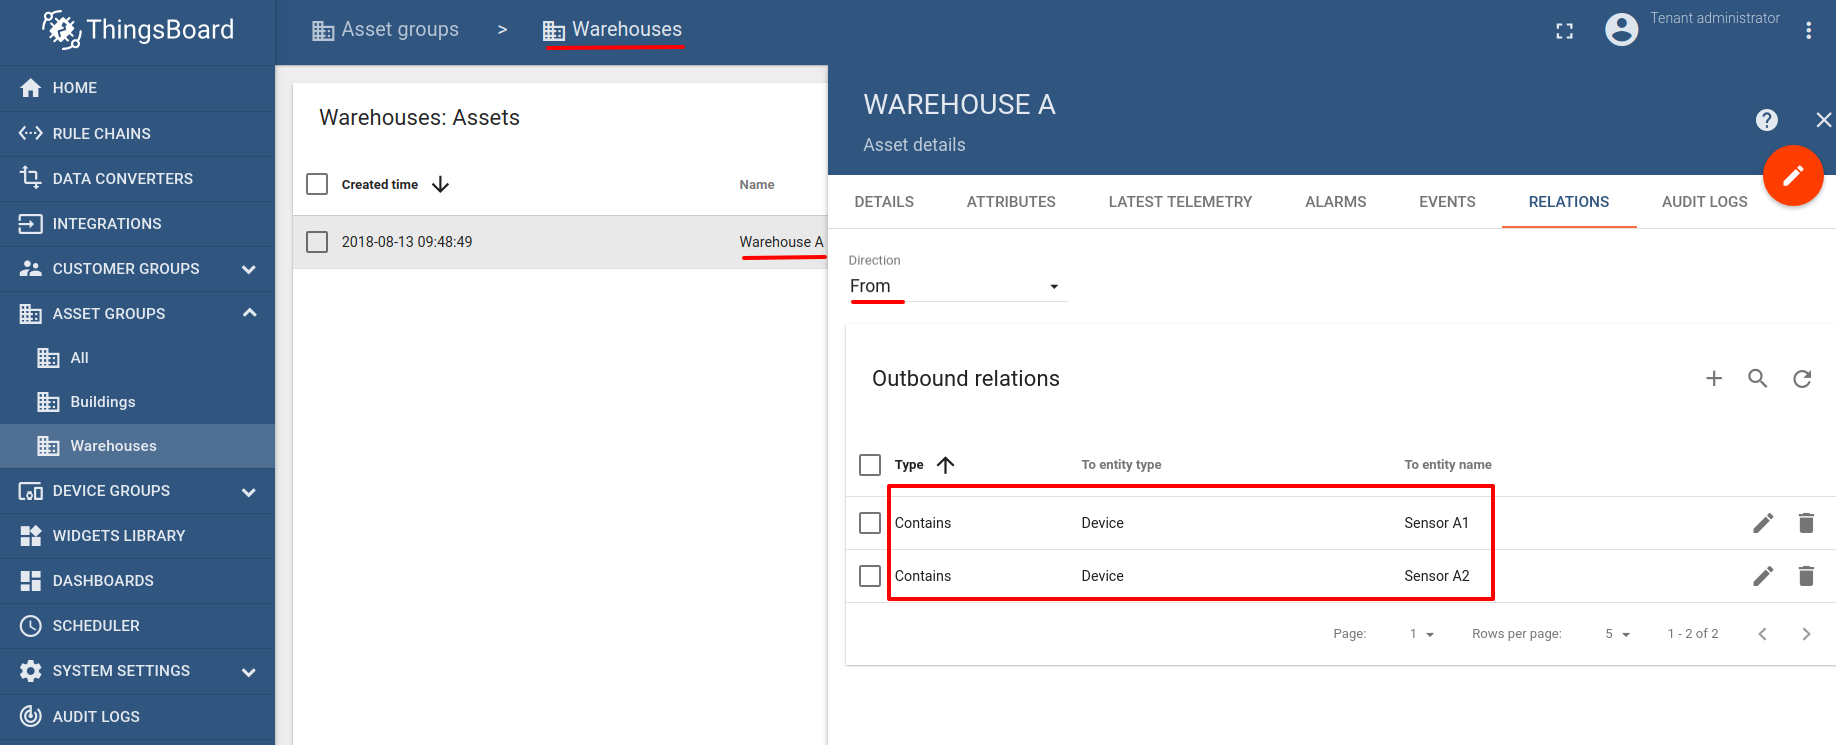
We must also create relations between the warehouse asset and thermometers. This relation will be used in the rule chain to associate thermometer readings with the warehouse itself. It is also convenient to use relations in the dashboards to provide drill-down capabilities. You may notice two outbound relations from the warehouse asset to the thermometers on the screenshot below:
Note: Please review the following documentation page to learn how to create assets and relations.
Message Flow
In this section, we explain the purpose of each node in this tutorial. There will be two rule chains involved:
- “Thermometer Emulators” - optional rule chain to simulate data from two temperature sensors;
- “Warehouse Temperature” - rule chain that actually calculates average temperature in the warehouse;
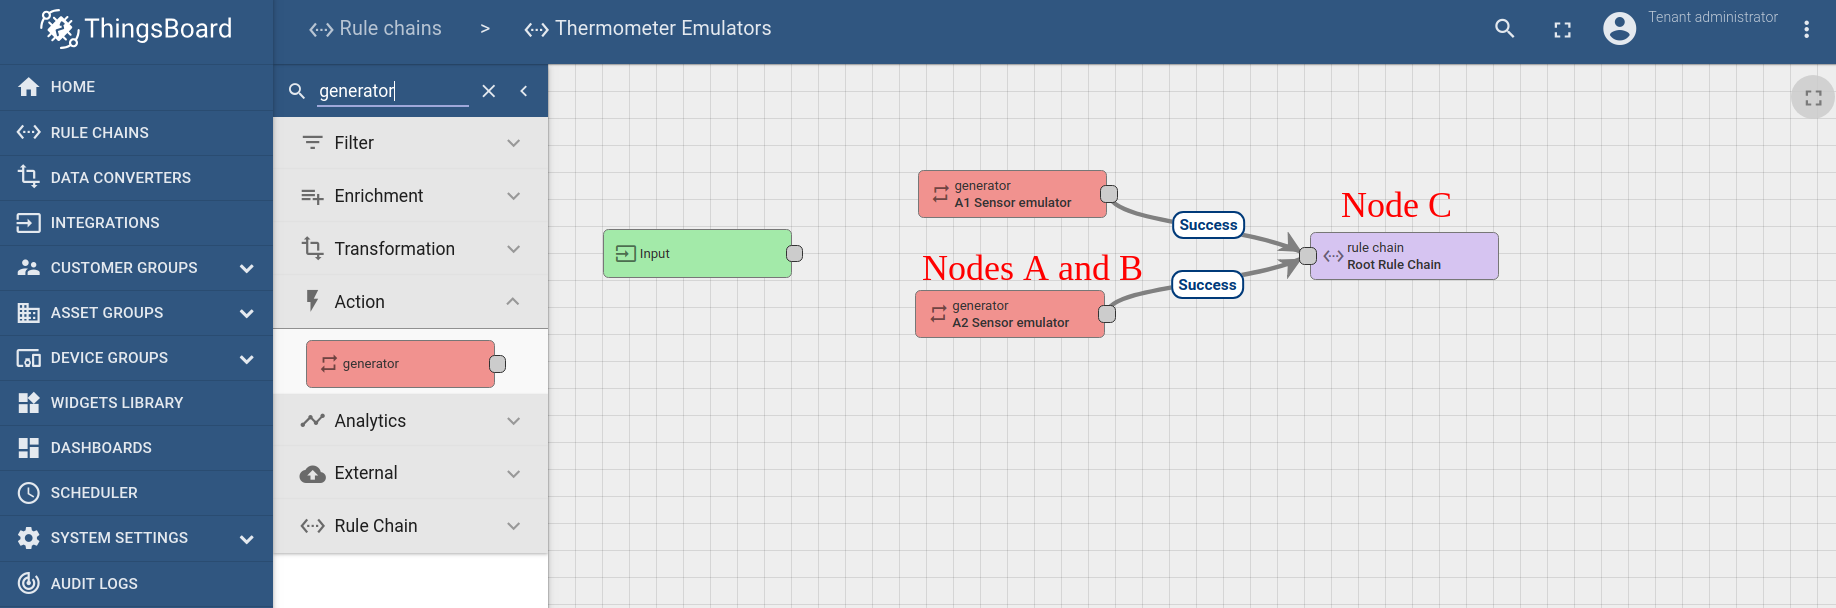
Thermometer Emulators rule chain
-
Nodes A and B: Generator nodes
- Two similar nodes that periodically generate a very simple message with random temperature reading.
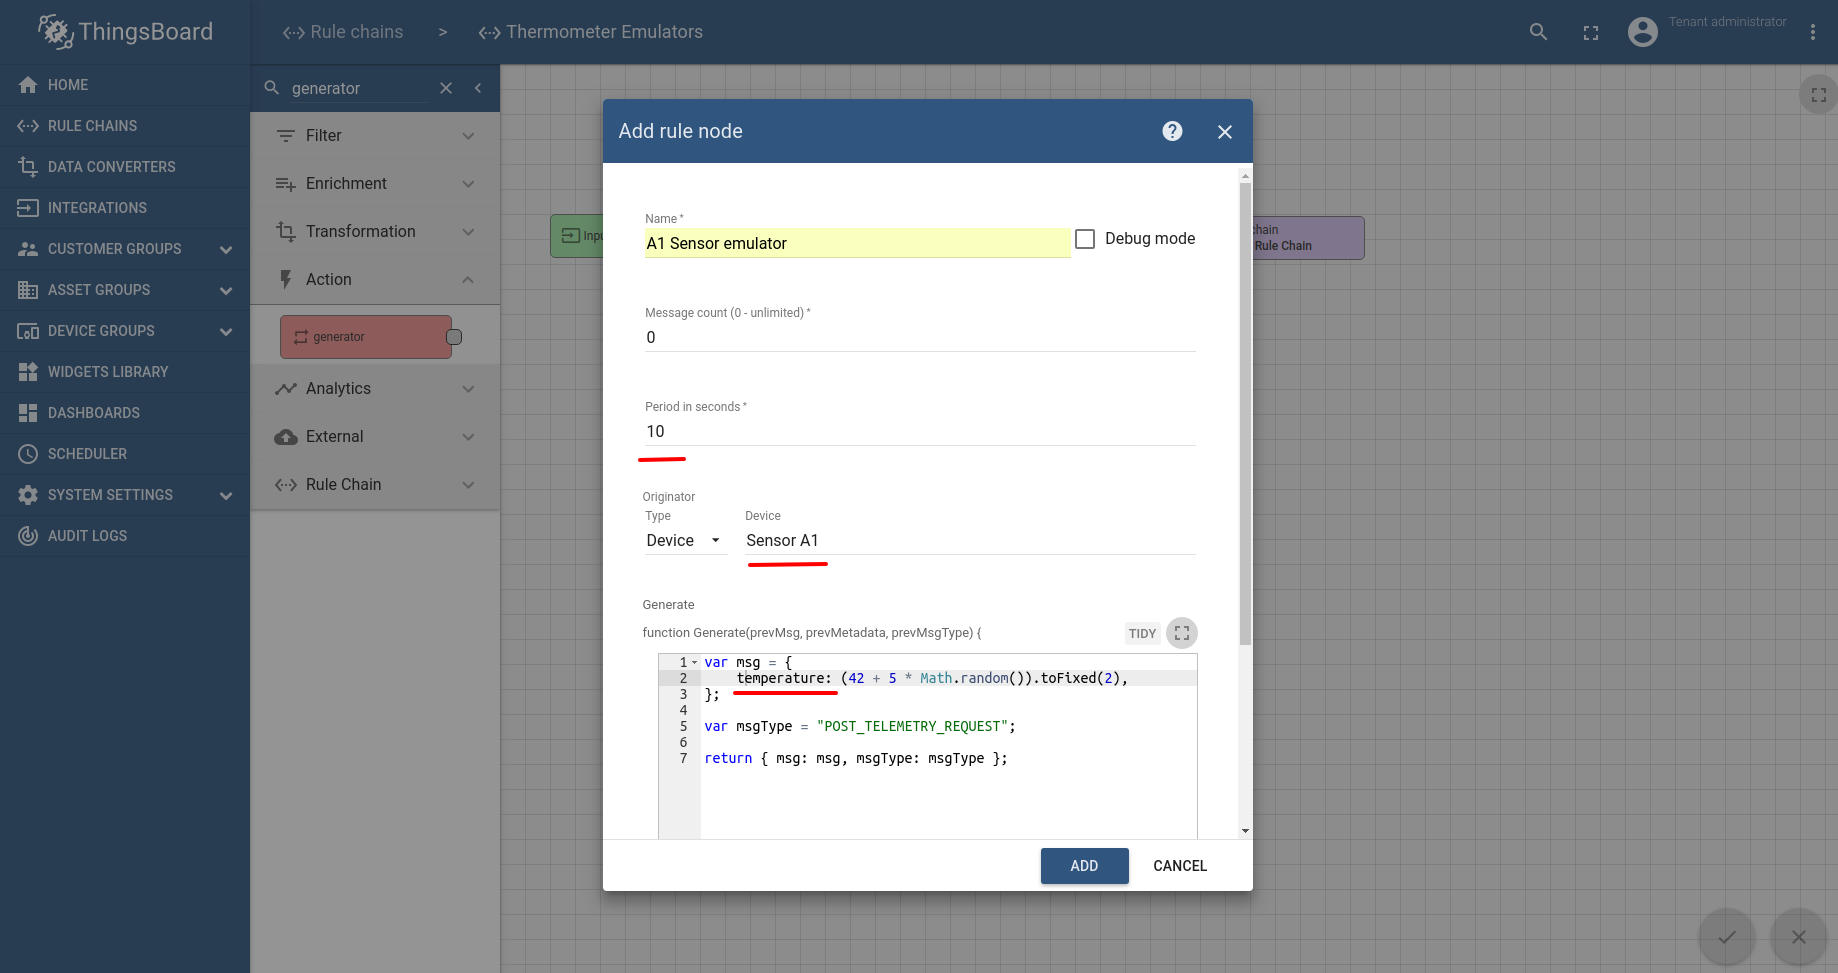
-
Node C: Rule Chain node
- Forwards all messages to default rule chain.
Warehouse Temperature rule chain
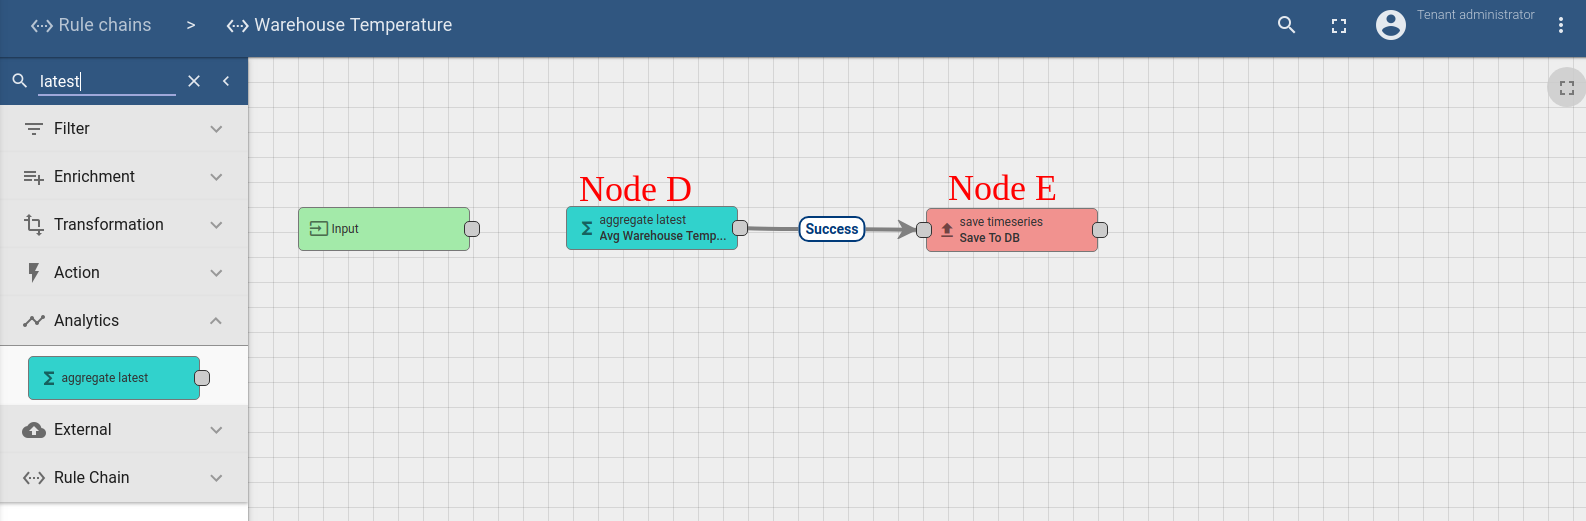
-
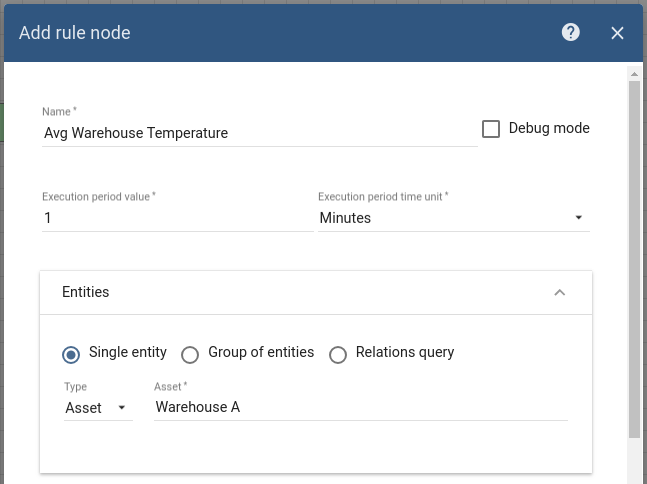
Node D: Aggregate latest. Periodically (period of execution is defined as “Execution period value”) executes the following:
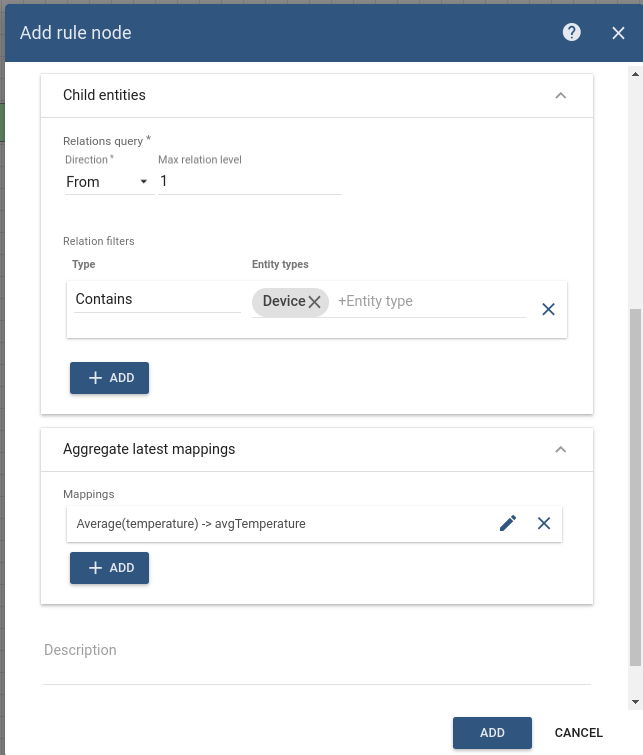
- Fetches all devices related to the “Warehouse A” asset using “Contains” relation.
- Fetches latest temperature reading for each of the devices and calculates average temperature reading.
- Generates “POST_TELEMETRY_REQUEST” message that contains value of the average temperature.
-
Node E: Save telemetry node
- Simple node that stores incoming message to the database and dispatches updates to the subscribers.
Configuring the Rule Chains
Download and import attached emulators rule chain file as a new “Thermometer Emulators” rule chain and attached warehouse temperature rule chain file as a new “Warehouse Temperature” rule chain. Please note that some nodes have debug enabled. This affects performance. Create Node C as shown on the image above in the thermometer emulators rule chain to forward telemetry to the root rule chain.
Validating the flow
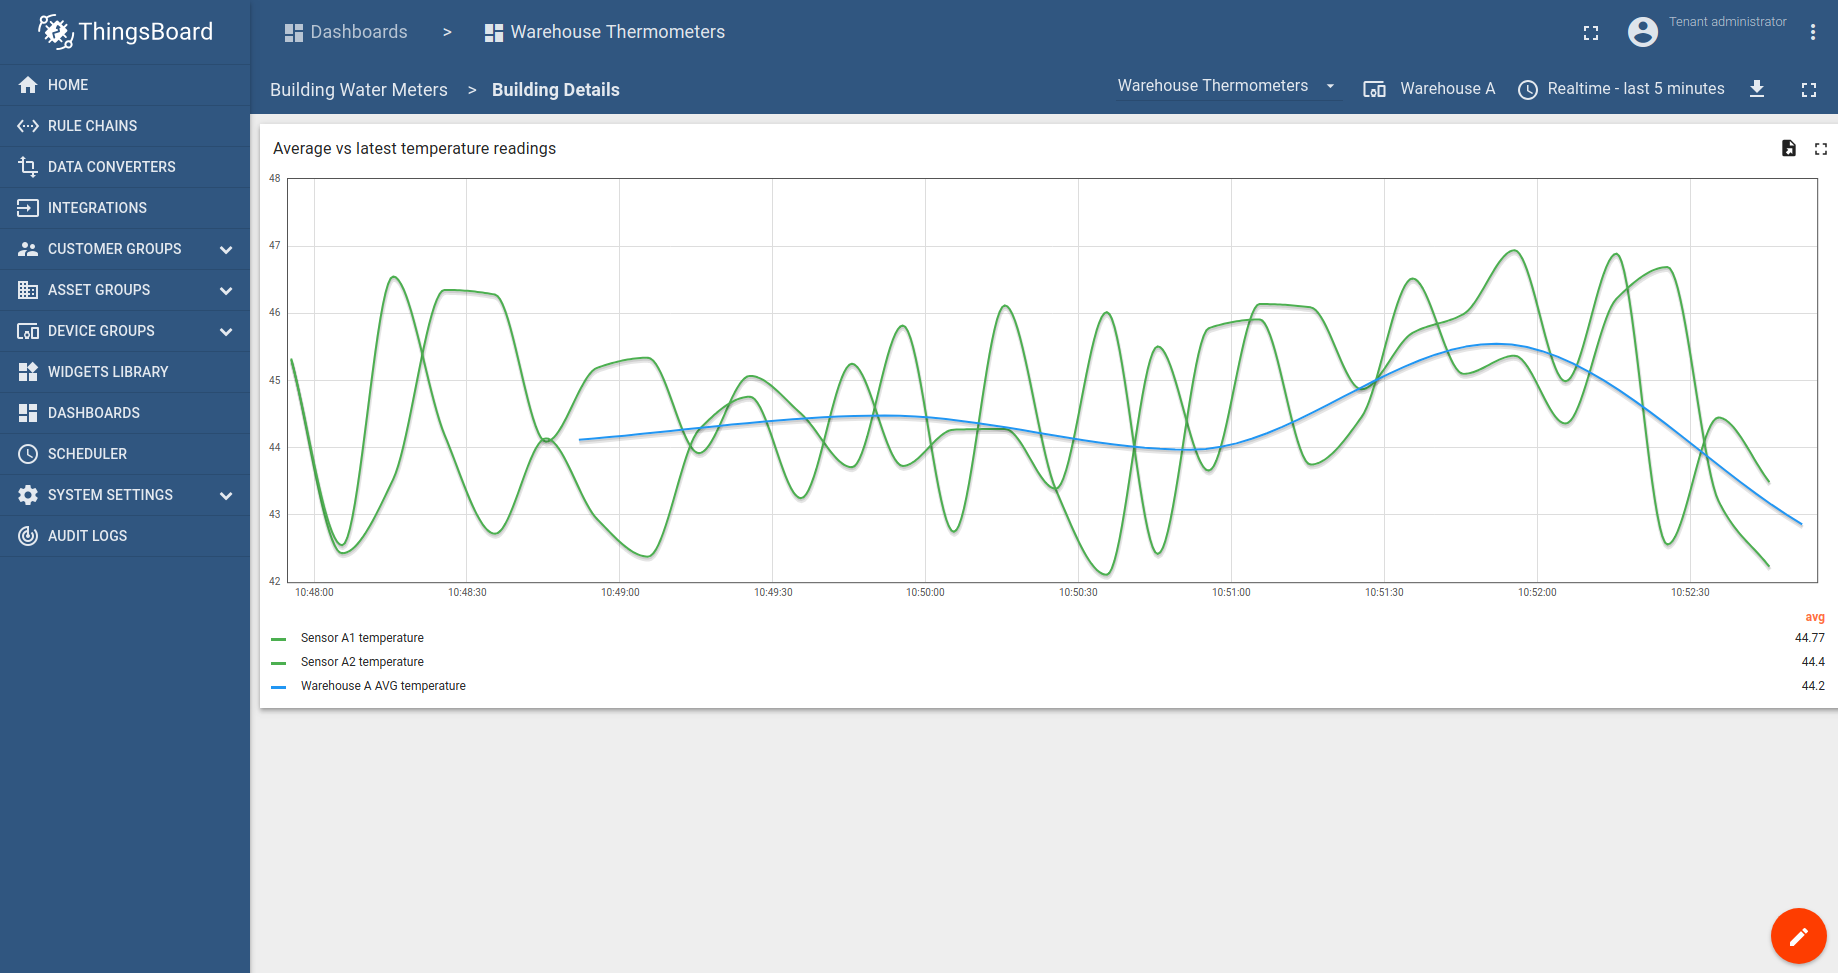
Download and import attached dashboard file as a new “Warehouse Temperature” dashboard.
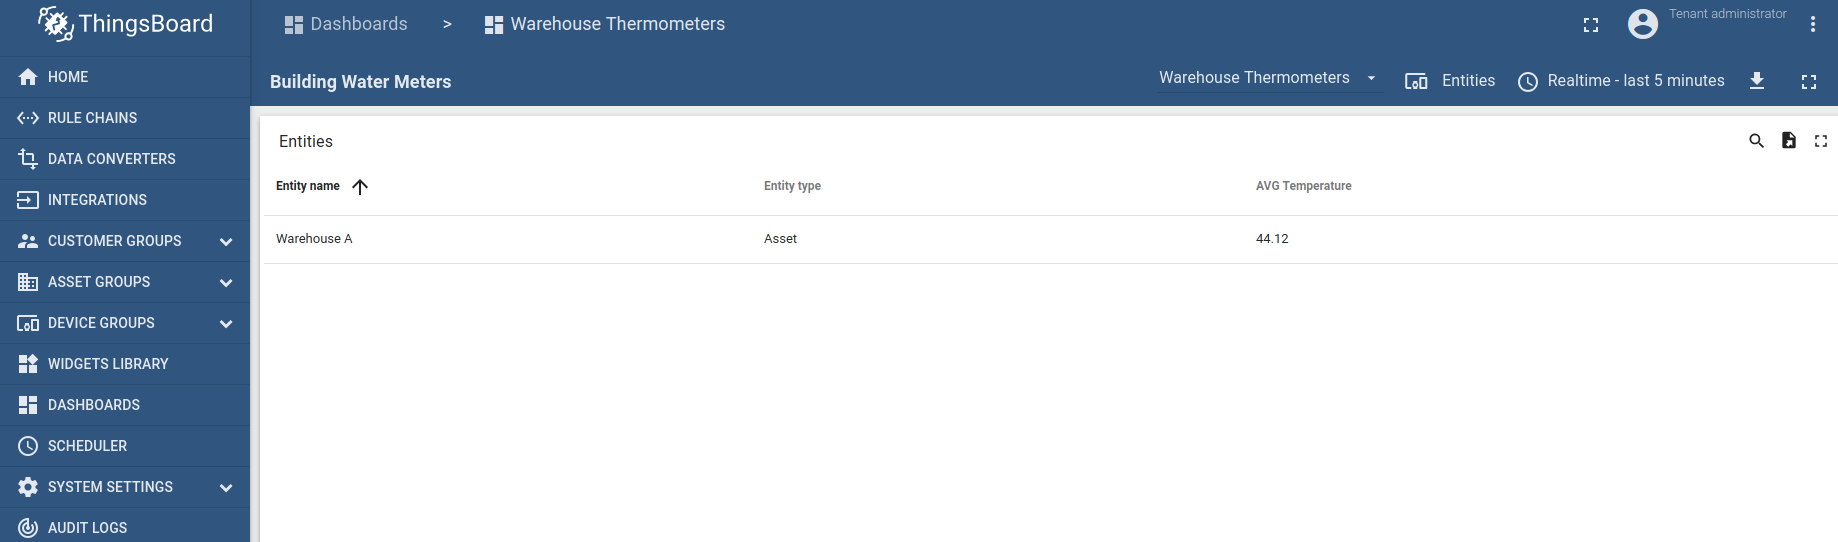
Note that you can drill down to the chart for particular warehouse by clicking on the corresponding row.
Next steps
-
Getting started guides - These guides provide quick overview of main ThingsBoard features. Designed to be completed in 15-30 minutes.
-
Installation guides - Learn how to setup ThingsBoard on various available operating systems.
-
Connect your device - Learn how to connect devices based on your connectivity technology or solution.
-
Data visualization - These guides contain instructions how to configure complex ThingsBoard dashboards.
-
Data processing & actions - Learn how to use ThingsBoard Rule Engine.
-
Hardware samples - Learn how to connect various hardware platforms to ThingsBoard.
-
Advanced features - Learn about advanced ThingsBoard features.
-
Contribution and Development - Learn about contribution and development in ThingsBoard.